Tuesday 30 August 2016

Highs and Lows Indicator (Release 4)

I've just uploaded a new version of the Highs and Lows indicator.

Release 4:
  • Added �Quarter� option
  • Added option to show lines �full-screen� (or just from the start of the day/week/month/etc.)


More information can be found here.
Read more ...

Thursday 25 August 2016

Supply/Demand (Release 5) and Support/Resistance (Release 5)

I've just uploaded a new version of the Supply/Demand and Support/Resistance indicators. The change is actually the same for both (since they share a lot of common code).

Release 5:
  • When �Historic data� size is set to 0, it uses the chart data rather than loading separate data source


More information on the Supply/Demand indicator can be found here.
More information on the Support/Resistance indicator can be found here.
Read more ...

Zig-Zag (Release 8)

I've just uploaded a new version of the Zig-Zag (Weis Wave) indicator. The version has a couple of new label styles which were requested by customers.


The latest version can be download from the site. More information on the indicator can be found here.
Read more ...

Wednesday 24 August 2016

Cara Update FTI Versi Demo Bagi Pengguna Excel 2007


Read more ...

Tuesday 23 August 2016


Dashboard di atas merupakan salah satu fitur terbaru  yang di miliki
oleh FTI (Forex Trend Indicator), Fitur ini bertujuan untuk  memini
malisir kesalahan trader dalam  menentukan  entry point  BUY atau 
SELL posisi. Pada fitur di atas akan menampilkan signal secara auto
matic dan trader hanya menunggu  trend tersebut dan mengikuti nya

Entry Point Statement (EPS) terdiri dari 3 bagian ;
1. Trend Up Currency Area (Buy Area Table)

Pada bagian ini terdiri dari  beberapa kolom, yaitu 
  • Kolom trend mata uang, Pada kolom ini akan muncul nama mata uang sebagai mata uang yang akan ter identifikasi sebagai mata uang yang kuat (BUY currency) 
  • Nomor. Merupakan urutan penomoran pada pasangan mata uang sebanyak 7 pair
  • Symbol Setiap mata uang yang muncul di kolom trend mata uang, maka otomatis pada kolom ini akan terlihat 7 pair mata uang, yang pair nya  berhubungan dengan trend mata uang tsb
  • Type (BUY / SELL), Menjelaskan tentang signal pada masing-masing pair
  • Bid/ask  (harga entry), merupakan harga entry dari setiap pair
  • Market (harga running ), harga pada masing-masing pair
  • + (plus) , merupakan pips away from low 
  • - (minus), merupakan pips away from high
  • Total ,  total range pada pair 
  • Spread , nilai spread pada pair 
  • Profit, nilai profit yang di hitung dari spread 
  • TP (Take Profit), merupkan di set up secara otomatis pada level S2 atau R2 dari APP indicator
  • S3-S2-S1-P-R1-R2-R3 merupakan bagian dari APP (Auto Pivot Plotter)  
Pada baris terakhir spt pada gambar ini terlihat (klik gambar u/ memperbesar)


Ini merupakan summary trend up yang terjadi
USD 6  -   NZD -  NZD -  USD - NZD
ini artinya NZD menguasi trend, tp pada sisi lain USD juga trend up dengan 6 trend pair artinya mata uang USD ini menguasi 6 pair dengan mendapatkan nilai pips di bawah angka 10.
Seperti pada gambar di bawah ini


        Perhatikan angka dengan latar belakang warna kunin, dan  hitunglah !

        Dan pengurutan trend mata uang terebut juga dapat di lihat spt ini, terdapat pada sisi kanan bawah BUY area
        2. Trend Down Currency Area (Sell Area Table)

        Pada bagian ini juga terdapat kolom yang fungsi nya sama pada Buy Area Table, 

        3. Setting Parameter 

        Kita bahas per bagian, parhatikan gambar di bawah ini

        Manual trading tools
        Fungsi tool ini adalah, untuk menampilkan trend secara manual pada tabel BUY / SELL area
        Caranya dengan meng- klik pada salah satu mata uang 

        Trade setting tools


          Merupakan kumpulan dari semua trend yang terdapat pada FTI ini
          (silakan di cek pada masing-masing trend dashboard

          Catatan :
          Untuk mengetahui trend pada suatu tabel, apakah AUTO atau MANUAL
          bisa di lihat seperti pada gambar ini


          Read more ...

          AUD / USD Free Signal (Closed)

          Open in:
          23August , 09:16:00 GMT
          AUD/USD free signals 2017


          Sell
          AUD / USD 
          @ 0.76405
          TP : 0.7624
          SL :  0.7689

          Closed : Hit TP
          Profit : 16.5 Pips
          Read more ...

          Friday 19 August 2016


          FTI Entry Point with Entry Point Statement (EPS)

          Read more ...

          Monday 15 August 2016

          New version of Line Sync coming soon

          I've been working on this one for months, and my writing this blog post is basically a way to force myself to finish it off !

          The existing version of Line Sync has a bug with trend line extensions (caused during last update of MarketScope). I also wanted to add some new features (such as zones and price channels). However, both of these required total overhaul of the graphics system. On top of that the user interface (which is already quite klunky due to platform limitations) was getting too complex, so I'm having a major overhaul of that too.

          To cut a long story short, this is almost a 100% re-write of the tool. I'm almost there now though, just a couple more features and some testing.

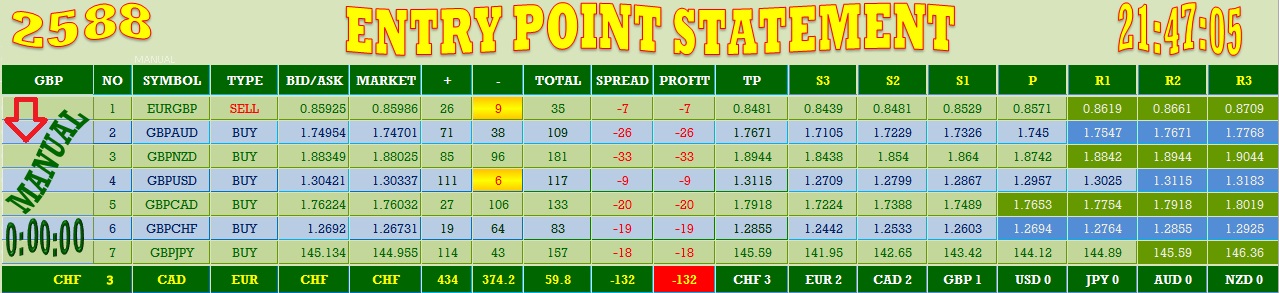
          Here's a sneaky peak of how it looks at the moment...


          More information on Line Sync (current version) can be found here.
          Read more ...