Friday 28 November 2008

Forex Trend Trading: The Early Bird Gets the Cash

Trend trading is where the big money is in the Forex market. While there is money to be made in counter-trending markets, there is only so much that can be made when the market is essentially moving sideways.

Trading when the market trends is where there is the opportunity to make (and if you're on the wrong side without a stop-loss, possibly lose) major money.

A market goes into a trend anytime there are more buyers than sellers or more sellers than buyers over a prolonged period of time. This trend can be with prices going up (more buyers than sellers) or down (more sellers than buyers). There is money to be made regardless of which way the trend goes, since all trading is done with pairs.

Figuring out the best way to trade trends involves knowing extensive technical analysis, so having a proven and profitable trading system helps immensely. Without a prove and profitable trading system, it's very unlikely that over the long run, you will profit from Forex trend trading.

While there are all sorts of technical tools for analyzing trades, the simplest way to spot a trend, or what might be the beginning of a trend, is to watch and see if each time period's high keeps getting higher, indicating the market is steadily trending up in price, or if each period's low continues to get lower, indicating a downward trend in price.

If you decide to use bands to help your trend trading, remember that a basic rule when using bands is to wait and see when the high price penetrates the upper band. This is your signal that an upward trend is about to start. You want to buy when that price penetrates the upper band and go long, with a trailing stop loss. There's a good chance the market will make an upward trend that a long position can profit from.

When the price penetrates the lowest band of your corridor, you want to sell and go short, watching the market for any confirmations on any further trends, counter-trends, or pivot points that indicate a trend reversal.

The basic goal of trend trading strategies is always the same. While you don't want to be the first to test the market, once a market trend reveals itself: join the move early!

Then hold your position, making as much money as possible, until the trend reverses and then get out. This is where using a trailing stop loss can help maximize the profits you earn from any market movement.

Trend trading is where the big money is at, and recognizing and getting in on trends early will make you a very happy (and wealthy) trader in the Forex market.

--- by Jason fielder ------

Read more ...

Wednesday 26 November 2008

Free Forex Signal

Free Forex Signal, 27 November 2008
Update every day at 01.30 am GMT ( 08.30 WIB )

Today update 03.50 am GMT

All Pair � Stop loss 30 Pips


EUR/USD
Pivot : 1.2918
Avg. Daily Range : 267 point
BUY at 1.2945 Exit Target 15 pips
SELL at 1.2858 Exit Target 20 pips


GBP/USD
Pivot : 1.5327
Avg.Daily range : 347 point
BUY at 1.5414 Exit Target 15 pips
SELL at 1.5316 Exit Target 20 pips


USD/JPY
Pivot : 95.27
Avg.Daily range : 188 point
BUY at 95.39Exit Target 15 pips
SELL at 94.89Exit Target 20 pips


AUD/USD
Pivot : 0.6488
Avg.Daily range : 228 Point
BUY at 0.6527 Exit Target 15 pips
SELL at 0.6465 Exit Target 20 pips


CHF / USD & USD/CAD � Stop loss 35 pips
GOLD � Stop loss 350 pips ( 3,5 USD )

USD/CHF
Pivot : 1.1985
Avg. Daily range : 216 point
BUY at 1.2015 Exit Target 15 pips
SELL at 1.1992 Exit Target 20 pips


Usd/Cad
Pivot : 1.2296
Avg.Daily range : 323 point
BUY at 1.2329 Exit Target 15 pips
SELL at 1.2254 Exit Target 20 pips


GOLD
Pivot : 814.35
Avg.Daily range : 2662 point
BUY at 818.90 Exit Target 150 pips
SELL at 813.10 Exit Target 150 pips

Note : Gold � Stop Loss 350 pips ( 3.5 usd )

Tag tags forex signal Free Forex Signal forex Indicator

Read more ...

Sunday 23 November 2008

Forex Tips and Strategy

Use an RSI Indicator to Make Your Forex Trading More Profitable

When it comes to forex-based technical analysis, using the relative strength index (RSI) indicator or your chart can give you insight into potential trading opportunities.

First, let's talk about what the RSI is, how it is set up on your chart, and how it can be used to decide when to enter the market.

The RSI is an oscillator, meaning that it will be separate from price data but still on the same chart and it will go up and down (oscillate) in value from 0 to 100.

When it comes to setting up your RSI indicator on the chart, the most popular setting is a 14-day period, though it is possible to tweak this setting to fit your own strategy.

Keep in mind though, that the longer the period is on your RSI indicator, the less frequently it will give trading signals, though the signals that it does give can be considered more reliable.

If the period is much shorter (like 8 or 9 instead of 14), the oscillator will be much more volatile and can give false signals more frequently, so it is important to find a balance.

Now when it comes to actually reading the RSI for trading signals, there are two main methods of doing this. With the first one, the values 30 and 70 are of critical importance (remember the RSI always gives a value between 0-100).

Typically, the lows and highs of the RSI will be below 30 and above 70, so when the RSI reaches this level and stays there, you can be sure that when it changes direction and heads closer to 50 then you will see a trend or market reversal.

For example, you are using a 10-minute bar chart and 14-period RSI. You see that the RSI has crossed the 70 line, moved to around 80 for maybe 40 minutes, and is now climbing back down. This could be a good indication that the market prices will follow and this could be a good time to sell. Your indication to enter would be when the RSI crosses 70 and continues going down.

The other popular way to trade the RSI is to use the number 50 as a center line or deviation line. This means that when the RSI crosses the center line and continues to climb steadily, this could be an indication to buy.

Conversely, if the RSI crosses the center line and continues to decline steadily, this could be a good indication to sell.

One important thing to always remember when you are using the RSI indicator on your charts is that the main purpose of this oscillator is to convey the current strength of the market, and whether or not a trend is likely to continue or reverse. Happy Trading!

--- by; Marcus Mst ------
Read more ...

Monday 17 November 2008

FREE FOREX SIGNAL

Free Forex Signal, 18 November 2008
Update every day at 01.30 am GMT ( 08.30 WIB )

Today update 02.30 am GMT

All Pair � Stop loss 30 Pips


EUR/USD
Pivot : 1.2634
Avg. Daily Range : 288 point
BUY at 1.2679 Exit Target 15 pips
SELL at 1.2598 Exit Target 20 pips


GBP/USD
Pivot : 1.4898
Avg.Daily range : 445 point
BUY at 1.5036Exit Target 15 pips
SELL at 1.4932 Exit Target 20 pips


USD/JPY
Pivot : 96.56
Avg.Daily range : 216 point
BUY at 96.77 Exit Target 15 pips
SELL at 96.27 Exit Target 20 pips


AUD/USD
Pivot : 0.6476
Avg.Daily range : 278 Point
BUY at 0.6468 Exit Target 15 pips
SELL at 0.6420 Exit Target 20 pips


CHF / USD & USD/CAD � Stop loss 35 pips
GOLD � Stop loss 350 pips ( 3,5 USD )

USD/CHF
Pivot : 1.1964
Avg. Daily range : 160 point
BUY at 1.2012 Exit Target 15 pips
SELL at 1.1986 Exit Target 20 pips


Usd/Cad
Pivot : 1.2273
Avg.Daily range : 323 point
BUY at 1.2323 Exit Target 15 pips
SELL at 1.2227 Exit Target 20 pips


GOLD
Pivot : 738.62
Avg.Daily range : 2787 point
BUY at 741.90 Exit Target 150 pips
SELL at 733.70 Exit Target 150 pips

Note : Gold � Stop Loss 350 pips ( 3.5 usd )

Tag tags forex signal Free Forex Signal forex Indicator

Read more ...

Sunday 16 November 2008

FREE FOREX SIGNAL

Free Forex Signal, 17 November 2008
Update every day at 01.30 am GMT ( 08.30 WIB )

Today update 02.35 am GMT

All Pair � Stop loss 30 Pips


EUR/USD
Pivot : 1.2663
Avg. Daily Range : 289 point
BUY at 1.2595 Exit Target 15 pips
SELL at 1.2503 Exit Target 20 pips


GBP/USD
Pivot : 1.4784
Avg.Daily range : 414 point
BUY at 1.4775 Exit Target 15 pips
SELL at 1.4652 Exit Target 20 pips


USD/JPY
Pivot : 97.01
Avg.Daily range : 226 point
BUY at 97.36 Exit Target 15 pips
SELL at 96.34 Exit Target 20 pips


AUD/USD
Pivot : 0.6546
Avg.Daily range : 287 Point
BUY at 0.6509 Exit Target 15 pips
SELL at 0.6393 Exit Target 20 pips


CHF / USD & USD/CAD � Stop loss 35 pips
GOLD � Stop loss 350 pips ( 3,5 USD )

USD/CHF
Pivot : 1.1923
Avg. Daily range : 174 point
BUY at 1.2008 Exit Target 15 pips
SELL at 1.1954 Exit Target 20 pips


Usd/Cad
Pivot : 1.2279
Avg.Daily range : 314 point
BUY at 1.2425 Exit Target 15 pips
SELL at 1.2339 Exit Target 20 pips


GOLD
Pivot : 740.04
Avg.Daily range : 3103 point
BUY at 745.80 Exit Target 150 pips
SELL at 736.20 Exit Target 150 pips

Note : Gold � Stop Loss 350 pips ( 3.5 usd )


Forex Tech. Indicator ....Click here....

Tag tags forex signal Free Forex Signal forex Indicator

Read more ...

Thursday 13 November 2008

FREE FOREX SIGNAL

Free Forex Signal, 14 November 2008
Update every day at 01.30 am GMT ( 08.30 WIB )

Today update 02.40 am GMT

All Pair � Stop loss 30 Pips


EUR/USD
Pivot : 1.2676
Avg. Daily Range : 338 point
BUY at1.2818 Exit Target 15 pips
SELL at 1.2645 Exit Target 20 pips


GBP/USD
Pivot : 1.4796
Avg.Daily range : 440 point
BUY at 1.4934 Exit Target 15 pips
SELL at 1.4762 Exit Target 20 pips


USD/JPY
Pivot : 96.78
Avg.Daily range : 262 point
BUY at 97.45Exit Target 15 pips
SELL at 96.53Exit Target 20 pips


AUD/USD
Pivot : 0.6560
Avg.Daily range : 318 Point
BUY at 0.6658 Exit Target 15 pips
SELL at 0.6556 Exit Target 20 pips


CHF / USD & USD/CAD � Stop loss 35 pips
GOLD � Stop loss 350 pips ( 3,5 USD )

USD/CHF
Pivot : 1.1898
Avg. Daily range : 185 point
BUY at 1.1908 Exit Target 15 pips
SELL at 1.1836 Exit Target 20 pips


Usd/Cad
Pivot : 1.2212
Avg.Daily range : 342 point
BUY at 1.2211 Exit Target 15 pips
SELL at 1.2098 Exit Target 20 pips


GOLD
Pivot : 723.69
Avg.Daily range : 3386 point
BUY at 734.70 Exit Target 150 pips
SELL at 723.10 Exit Target 150 pips

Note : Gold � Stop Loss 350 pips ( 3.5 usd )
Tag tags forex signal Free Forex Signal forex Indicator

Read more ...

Sunday 9 November 2008

FREE FOREX SIGNAL

Free Forex Signal, 10 November 2008
Update every day at 01.30 am GMT ( 08.30 WIB )

Today update 04.35 am GMT

All Pair � Stop loss 30 Pips


EUR/USD
Pivot : 1.2740
Avg. Daily Range : 304 point
BUY at 1.2932 Exit Target 15 pips
SELL at 1.2814 Exit Target 20 pips


GBP/USD
Pivot : 1.5681
Avg.Daily range : 456 point
BUY at 1.5892 Exit Target 15 pips
SELL at 1.5803 Exit Target 20 pips


USD/JPY
Pivot : 97.90
Avg.Daily range : 219 point
BUY at 99.36 Exit Target 15 pips
SELL at 89.62 Exit Target 20 pips


AUD/USD
Pivot : 0.6693
Avg.Daily range : 291 Point
BUY at 0.6952 Exit Target 15 pips
SELL at 0.6929 Exit Target 20 pips


CHF / USD & USD/CAD � Stop loss 35 pips
GOLD � Stop loss 350 pips ( 3,5 USD )

USD/CHF
Pivot : 1.1752
Avg. Daily range : 192 point
BUY at 1.1759 Exit Target 15 pips
SELL at 1.1696 Exit Target 20 pips


Usd/Cad
Pivot : 1.1858
Avg.Daily range : 351 point
BUY at 1.1841 Exit Target 15 pips
SELL at 1.1725 Exit Target 20 pips


GOLD
Pivot : 735.30
Avg.Daily range : 2902 point
BUY at 751.90 Exit Target 150 pips
SELL at 742.90 Exit Target 150 pips

Note : Gold � Stop Loss 350 pips ( 3.5 usd )

Tag tags forex signal Free Forex Signal forex Indicator

Read more ...

Friday 7 November 2008

ForexBasic balanced system

Current Forex trading system represents a well thought and very simple combination of indicators. Knowing what signal to look for with each indicator, provides a strong tip for good entries and exits.
Time frame: Any.
Currency: Any.

Indicators: 5 EMA, 10 EMA, Stochastic (14, 3, 3), RSI (14, 70, 30)
Entry rules: Buy when 5 EMA crosses above 10 EMA and Stochastic lines are heading north (up) and Stochastic is not in overbought position (above 80.00 level) and RSI is above 50.
Entry rules: Sell when 5 EMA crosses below 10 EMA and Stochastic lines are heading south (down) and Stochastic is not in oversold position (below 20.00 level), and RSI is below 50.
Exit rules: when 5 EMA and 10 EMA cross in the opposite direction or if RSI crosses the 50 mark again.

Advantages: allows filtering entries and thus is more accurate.
Disadvantages: 5 and 10 EMAs can give very early exit signals

--- By; FxStrtgyRvld ------

Tag tags FOREX Trading Strategy Forex INDICATOR
Read more ...

Tuesday 4 November 2008

Free Forex Signal

Free Forex Signal, 05 November 2008
Update every day at 01.30 am GMT ( 08.30 WIB )

Today update 02.20 am GMT

All Pair � Stop loss 30 Pips


EUR/USD
Pivot : 1.2854
Avg. Daily Range : 397 point
BUY at 1.2990Exit Target 15 pips
SELL at 1.2868Exit Target 20 pips


GBP/USD
Pivot : 1.5892
Avg.Daily range : 514 point
BUY at 1.5972 Exit Target 15 pips
SELL at 1.5848 Exit Target 20 pips


USD/JPY
Pivot : 99.60
Avg.Daily range : 259 point
BUY at 99.97 Exit Target 15 pips
SELL at 99.36 Exit Target 20 pips


AUD/USD
Pivot : 0.6856
Avg.Daily range : 361 Point
BUY at 0.6959 Exit Target 15 pips
SELL at 0.6868 Exit Target 20 pips


CHF / USD & USD/CAD � Stop loss 35 pips
GOLD � Stop loss 350 pips ( 3,5 USD )

USD/CHF
Pivot : 1.1661
Avg. Daily range : 246 point
BUY at 1.1705 Exit Target 15 pips
SELL at 1.1629 Exit Target 20 pips


Usd/Cad
Pivot : 1.1618
Avg.Daily range : 410 point
BUY at 1.1629 Exit Target 15 pips
SELL at 1.1507 Exit Target 20 pips


GOLD
Pivot : 751.11
Avg.Daily range : 4024 point
BUY at 763.30 Exit Target 150 pips
SELL at 753.20 Exit Target 150 pips

Note : Gold � Stop Loss 350 pips ( 3.5 usd )

Tag tags forex signal Free Forex Signal forex Indicator

Read more ...

Monday 3 November 2008

Stochastics Cross Signal

A useful strategy to reduce your losses using stochastics crossover signals

Stochastics are often used to generate buy and sell signals when the %FastD crosses above or below %SlowD. Just how good are these signals?

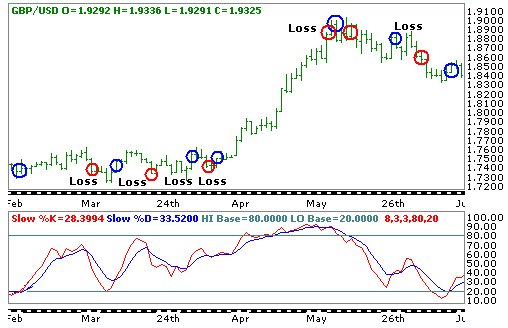
The stochastic plot here shows where entries are indicated:I have not circled all the signals but just four in the center of the chart that only shows the stochastic plot. The buy signal occurs when %FastD crosses above %SlowD and the sell signal occurs when the opposite is seen � when the %FastD crosses below %SlowD. However there are two other signals in between that provide first a sell signal and then a buy the next bar. This is rather annoying.

Let us seen how the entries might look on a chart.
Clearly, when there is a modestly sustained move the Stochastic crossovers can provide a reasonable profit but all too often in the small, rather tight range consolidations it can give back much too much of hard earned profits.

Is there any way we can try and prevent this give back? I tend to consider the plain signals provided by momentum indicators as too simple and in a way that doesn�t really fully take price development into consideration. Does a reversal of the %FastD through %SlowD constitute a directional reversal? Personally I do not think so.

Then what does represent directional reversals? Well, if you go back to a fundamental premise on what constitutes a trend it can be defined by looking for higher highs and higher lows in an uptrend and vice versa for a downtrend. If we then just trade without looking at the price chart just because %FastD has crossed through %SlowD then we�re really not think about what we�re doing. Quite often price can see a one or two bar reversal but not to the extent that it penetrates the most recent sequence of higher lows (in an uptrend) or lower highs (in a downtrend.)

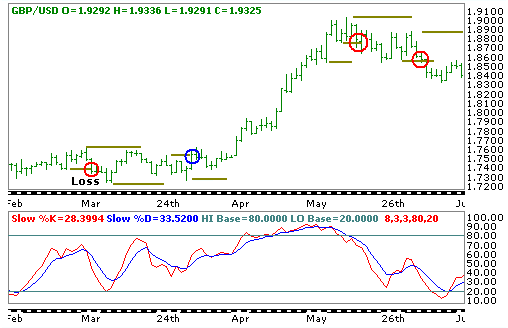
What we can do is stipulate that we�ll only buy on a Stochastic cross higher if price penetrates the last swing high, or if the Stochastic crossover is lower then on the breach if price penetrates the last swing low:You can see by doing this it does reduce the number of trades dramatically but actually takes out most of the losing trades. The first short sell to the bottom left of the chart will produce a loss � but this is compared to 6 losing trades without the price filter. The long trend is kept intact in the center of the chart as price rallies and is reversed soon after the peak. We then see two sell signals with no buy signals.

The techniques is not foolproof, as any methodology has its weak points at times, but it can be seen that using a price signal along with a momentum signals can dramatically reduce the number of losses you may need to take on using such a strategy.
Read more ...

Powerful chart tool and economic calendar


Forex Calendar

Read more ...

Sunday 2 November 2008

Free Forex Signal

Free Forex Signal, 03 november 2008
Update every day at 01.30 am GMT ( 08.30 WIB )

Today update 02.50 am GMT

All Pair � Stop loss 30 Pips


EUR/USD
Pivot : 1.2762
Avg. Daily Range : 313 point
BUY at1.2875 Exit Target 15 pips
SELL at1.2765 Exit Target 20 pips


GBP/USD
Pivot : 98.02
Avg.Daily range :304 point
BUY at 1.6342 Exit Target 15 pips
SELL at 1.6152 Exit Target 20 pips


USD/JPY
Pivot : 98.02
Avg.Daily range : 304 point
BUY at 99.68Exit Target 15 pips
SELL at98.86 Exit Target 20 pips


AUD/USD
Pivot : 0.6663
Avg.Daily range : 316 Point
BUY at 0.6887 Exit Target 15 pips
SELL at 0.6772 Exit Target 20 pips


CHF / USD & USD/CAD � Stop loss 35 pips
GOLD � Stop loss 350 pips ( 3,5 USD )

USD/CHF
Pivot : 1.1540
Avg. Daily range : 244point
BUY at 1.2056 Exit Target 15 pips
SELL at 1.1898 Exit Target 20 pips


Usd/Cad
Pivot : 1.2150
Avg.Daily range : 397 point
BUY at 1.2026 Exit Target 15 pips
SELL at 1.1905 Exit Target 20 pips


GOLD
Pivot : 728.30
Avg.Daily range : 3556point
BUY at 735.90 Exit Target 150 pips
SELL at 727.10 Exit Target 150 pips

Note : Gold � Stop Loss 350 pips ( 3.5 usd )

Tag tags forex signal Free Forex Signal forex Indicator

Read more ...