Friday 27 September 2013

The Elliott wave rules - Motive waves

The motive waves:

It's the pattern of the five wave, wave 2 corrects wave 1, wave 4 corrects wave 3. The sequence of wave 1 to wave 5 is corrected by the a b c sequence.
- The rules of impule wave:
  + Wave 1 can be the impulse wave, or leading diagonal triangle pattern.
  + Wave 2 cannot retrace past the beginning of the wave 1.
  + Wave 3 must be the impulse wave.
  + Wave 3 cannot be the shortest wave of three impulse wave (1,3,5). It is almost the longest wave.
  + Wave 4 cannot overlap the pick of wave 1.
  + Wave 2 and wave 4 must have the alternations (scale of price or the patterns).
  + Wave 5 can be the impulse wave or diagonal triangle pattern.


The extentions:

    The extentions are the elongated impulse waves with exaggerated subdivisions. It only appears on one of the impulse waves. Most extensions occur in the 3rd wave.


The truncations:

   The truncations is the situation that the 5th wave cannot move beyond the end of the 3rd wave. It often occurs following the strong extension of the 3rd wave.
The ending triangle ( 3-3-3-3-3)

   The ending triangle is the special type of motive wave, not yet the impulse wave. It take a wedge shape pattern with two converging lines, with each subwave subdividing into 3 wave.
You can see it in the image below:

The leading triangle (5-3-5-3-5)

   The leading triangle pattern is a special type of motive waves too, but the structure is not the same with the ending triangle. The 1st, 3rd, 5th wave of the leading triangle subdivide into 5 wave.


Read more ...

Saturday 21 September 2013

Forex forum Posting for free Money

URDU Forum Posting For Bonus:


Now Traders can make money without investing real Money , You can make easy money simply by posting on Forum :)

The simple method is to Not Copy and Spam .

Your mere knowledge can make you some real cash in form of bonus in This Forum .

For Those who cannot invest in Forex market and afford to lose , They simply can Post on this forum and Make dollars.

Afterwards They have to trade and Profits can be withdrawn .

The features are :
  • You can post In urdu
  • You can Make bonus as much as 250 $.
  • Profits can be withdrawn.
  • 0.20$ per post
  • 0.10$ per referral post.
  • No limits for daily Posting
Isn;t it great For newbies? Yeah sure it is.
Its So simple to post .

You Can Join This URDU FORUM POSTING BONUS FOREX HERE


Read more ...

Tuesday 17 September 2013

250 % forex bonus

250 % forex Deposit Bonus :)

One of the Leading Forex Broker of Asia is Giving away 250 % Forex Deposit Bonus , Isn't it a great Tool to lower the risk of Margin call .

Any one Can sign up for the Bonus , Whatever your deposit amount may be You will get 250 % Bonus.

In simple way Your exposure to market will be lessened by 250% , And your equity increases by 250%.

Do not miss the opportunity to become a new client and start trading 250% bonus!


To Sign up With The Best Broker of Pakistan Click here.

After You Make an account and deposit it , Goto this 250 % bonus claim and Claim your 250% bonus .
Read more ...

Sunday 15 September 2013

Basic Elliott wave theory- essential concepts

Introducing:
Ralph Nelson Elliott (1871�1948), a professional accountant, discovered the underlying social principles and developed the analytical tools in the 1930s. He published his theory of market behavior in the book The Wave Principle in 1938, summarized it in a series of articles in Financial World magazine in 1939.
The wave principle is dicovery that social or crowd, behavior trends and reverses in recognizable patterns. Using stock market data as his main research tool, Elliott discovered that the ever-changing path of stock market prices reveals a structural design that in turn reflects a basic harmony found in nature.

Until now, the Elliott wave theory is still one of the famous forcasting tools of the price movements. At now, one of the best research about elliott wave you can refer detail on "Elliott wave principle" Robert Prechter's books, search it on google.
The analysing system of elliott wave base on the wave patterns he discovered, at first we must understand the structure and the rules of the waves:

The five wave pattern, and the cycle:

The movement of the prices take the form of five waves of specific structure; Three waves of them, which are labeled 1,3,5 called impulse or motive wave, it indicates the direction of the trend, they are seperated by 2 countertrend interruptions, which are labelled 2 and 4, called corrective wave ( partial retracement).
"R.N. Elliott did not specifically state that there is only one overriding form, the "five wave" pattern, but that is undeniably the case. At any time, the market may be identified as being somewhere in the basic five wave pattern at the largest degree of trend. Because the five wave pattern is the overriding form of market progress, all other patterns are subsumed by it." - cited in Robert Prechter' book.

The rythm of five wave up and three wave down makes the complete cycle of eight waves. '1,2,3,4,5' is motive phase, and 'a,b,c' is corrective phase. Every wave can be subdivided to smaller wave, the image below will illustrate the cycle:


The wave degree can be subdevided into: grand cycle, supercyle, cycle, primary, intermediate, minor, minute, minuette.

Next post will introduce some basic rules of each wave types

Read more ...

Friday 13 September 2013

Demark pivot point, support and resistance level

Another way to identify the support and resistance you can use Demark pivot points. It was created by the Tom Demark, he is one of the famous technical analyst, you can find many information about him on the internet.
Here is the formula:

The value of X in the formula below depends on where the Close of the market is.

If Close < Open then X = (H + (L * 2) + C)
If Close > Open then X = ((H * 2) + L + C)
If Close = Open then X = (H + L + (C * 2))

R1 = X / 2 - L
PP = X / 4 (this is not an official DeMark number but merely a reference point based on the calculation of X)
S1 = X / 2 - H


You can get the indicator in here: Demarkpivotpoint.mq4
Read more ...

Murrey math support and resistance level

Murrey Math basic support and resistance level: like the pivot point, it generates the essential support and resistance level.

+ 2/8ths = This market is too high and needs monitoring closely.

+ 1/8ths = OverBought (Too high on enthusiasm)

Top 8/8ths = Upper end of the Octave (wants to stay in here)

7/8ths = Weak Fast Reverse Line

6/8ths = Pivot Reverse Line

5/8ths = Upper Trading Range (Comfortable trading in here)

4/8ths = 50% = hardest to break through (up or down) the 1st Time

3/8ths = Lower Trading Range (Comfortable trading in here)

2/8ths = Pivot Reverse Line

1/8ths = Weak Fast Reverse Line

Zero/8ths = Lower End of Octave (wants to stay in here)

- 1/8ths = Oversold (Too Low on enthusiasm)

- 2/8ths = This market is too Low and needs monitoring closely.


The two Murrey strategies are recommended:

+ Buy at 1/8 close at 4/8 or Buy at 0/8 close at 2/8

+ Sell at 7/8 close at 4/8 or Sell at 8/8 close at 6/8

For detail strategy, you can refer this one: Murrey math rule.pdf

You can download the indicator for MT4 platform here: Murrey_Math_Line_X_eng.mq4
And find other versions in my forex indicators collections
Read more ...

Point and figure chart ( X O chart)

Intructions

Point and figure chart is one of a popular chart was created by the japanese, don't like other chart, it solely calculate the price movement. The prices are showed on both axis. it has been described as one of the simplest systems for better determining solid entry and exit points in trading.


Calculation:

To display point and figure chart, you must specify the box unit, and mark X letter when the prices rise by the box size and mark O when the price fall by the box size

For example:  

I specify the box unit at 1 USD, the prices rise up from 10 to 15 USD, you mark X from 10 to 15, then prices fall down to 12, you mark O from 14 down to 12.

15 X
    14 X O
    13 X O
    12 X O
11 X
10 X

Some ways to use point and figure chart:

Source: http://www.investopedia.com


Read more ...

Basic Candle stick patterns

Spinning Tops :

Spinning top Candle pattern

Candle stick with a Long upper shadow , And long Lower shadow is Called Spinning Tops .
This Pattern Indicates Indecision Between Buyers and Sellers.


Marubozu:

When Candle has no upper and lower bodies Then this type of Candle is called Marubozu .
A white Marubozu Contains A long white body(For buyers) with no shadow . The Open price equals low price and high price equals Closing Price.
This type of Pattern is Bullish(Buyers) reversal pattern.

Marubozu candle pattern formation

A Black marubozu Is a Black body(for sellers) with no shadow. The open price equals High price and low price equals Clossing price.
This type of pattern is Bearish(seller) Reversal pattern.

DOJI :

Doji candle have same Open And Close Price . This pattern shows Indecision in The market. This is much like a Draw.

Doji formaton in chart


Whenever a Doji forms on your chart , Pay special attention to the preceding Candle sticks.
Doji pattern in bullish chart

Whenever this type of situation occurs in a Buyers Market (Bullish) Then it may be a sign of reversal.

Doji pattern in bearish chart

Also The same is result in Bearish Markets, When this happens in Bearish market It may be a strong sign of reversal.

In Short , Candlestick patterns Are essential when Trading , They provide an inner view of the market depth.

Download the Indicator for pattern recognition mt4 indicators and templates for trading .

Hammer and Hanging Man :

They have small bodies , Always having long lower shadows.
And short upper shadows.

Hammer and hanging man pattern formation


Hammer and hanging man pattern formation in chart


A Hammer is Bullish reversal pattern That forms during a downtrend.
Just because you see a Hammer is not essential for a Buy order , Wait for more Bullish patterns to show up.

Recognition criteria:

  • The long shadow is about two or three times the real Body.
  • Little or no upper shadow.
  • real body is at upper end of the Candle.
  • The color of real body is not important.
The Hanging man is  Bearish Reversal pattern. It appers in Uptrend.
The pattern indicates that there are no more buyers left to push the price.

Recognition criteria:

  • A long lower shadow which is about two or three tines the real body.
  • Little or no upper shadow.
  • Real body is at upper end of Candle.
  • the color of real body is not important.

Inverted Hammer and Shooting star:

These patterns are much like hamer and hanging man , The only difference is that they form a long Upper body instead of Long lower bodies.
They also usually form on the end of an uptrend or downtrend.
Inverted Hammer and shooting start pattern formation


Inverted Hammer and shooting start pattern formation in charts


The Inverted hammer occurs when price has been fallen , It suggest the end of a down trend momentum.
This pattern has alwas a Long upper body and This is a Sign of Reversal.

The Shooting star Is bearish reversal pattern.It occurs when price has been rising. It indicates a shift of momentum .
But before putting an order Confirm your pattern By More Bullish patterns .

These patterns were single candle patterns, You also need to confirm the trend By double candlestick patterns.


Dual Candle stick Patterns :

Engulfing Candles :

Bullish and Bearish engulfing Pattern


A Bullish Engulfing pattern is a Two candle stick patern that signals a Strong Up move coming. It happens when a Bearish Candle is supported by a Strong Bullish candle.
This is a Bullish reversal pattern.
A Bearish Engulfing Pattern Is opposite of Bullish engulfing Pattern. It suggests a Strong Down trend Coming , This happens when a Bullish candle is followed By a Strong Bearish Candle.
This is a Bearish reversal pattern.

Tweezer Bottoms and Tops :

The tweezers are Double candle patterns. These are reversal patterns.
It looks some thing like this.

Tweezer bottoms and Tweezer tops pattern


Tweezers Have following Characteristics.
  • The first candle is same as overall Trend.
  • The second candle is opposite to overall Trend.
  • The shadow of candles should be of equal length.Tweezer Tops should have same highs and tweezer bottoms should have same low.

Triple Candle stick Patterns :

Evening and morning Star Pattern :

Morning star and evening star pattern formation


Read more ...

Wednesday 11 September 2013

Renko chart indicator

Renko chart or brick chart, it's a more smoothed than candle stick chart, the price in the same scale will put in the same box (you can modify this box unit) , the changing of the box color generates the entry signal.
Renko chart isolates the underlying price trend by filtering out the minor price changes. So, renko charts can also be very helpful when determining support and resistance levels.

Calculation

Renko charts are always based on closing prices. You specify a "box size" which determines the minimum price change to display.

To draw Renko bricks, today's close is compared with the high and low of the previous brick (white or black):

+ If the closing price rises above the top of the previous brick by at least the box size, one or more white bricks are drawn in new columns. The height of the bricks is always equal to the box size.

+ If the closing price falls below the bottom of the previous brick by at least the box size, one or more black bricks are drawn in new columns. Again, the height of the bricks is always equal to the box size.

+ If prices move more than the box size, but not enough to create two bricks, only one brick is drawn. For example, in a two-unit Renko chart, if the prices move from 100 to 103, only one white brick is drawn from 100 to 102. The rest of the move, from 102 to 103, is not shown on the Renko chart.

In MT4 platform, you can use this renko live chart v3.4 EA to show the chart. Attact the EA in normal chart, modify the box unit, and then open the offline chart.

Here is the example:


you can set the indicator in this chart to get more accuracy signal.
sources: refer www.metastock.com
Read more ...

Pivot point

Pivot point is one of the popular way to identify the support and resistance level base on the relations with the high, low, open, close price of the previous day.

The fomula is:

pivot point (PP) = ( high+low+close)/3

supports and resistances level:

First support (S1) = 2*PP - high

First resistance (R1) = 2*PP-low

Second support (S2) = PP - (high - low)

Second resistance (R2) = PP + (high-low)

you can download the indicator indicate the pivot levels in here: pivot custom timeframe
Many version you can find in my indicators collections.
  

Read more ...

Tuesday 10 September 2013

Support and Resistance

Support and resistance in URDU and English :

Support and resistance is one of the most widely used concepts in trading. Strangely enough, everyone seems to have their own idea on how you should measure support and resistance.
Let's take a look at the basics first.
Support and resistance in urdu

How to draw support and resistance in chart
Support and resistance in chart

Trend Lines :

Trend lines are probably the most common form of technical analysis. They are probably one of the most underutilized ones as well.
They are very easy to Draw and Very easy to trade .
Through This method You can make easy money without any Indicator , But definitely Harmonic Patterns Are Far more Important also The Fibbonaci.

How do You draw Trend Lines?

To draw trend lines properly, all you have to do is locate two major tops or bottoms and connect them.
How to draw trend lines in Chart


As you Can see , Its so easy to draw , Also Many trading methods can be used Like , Range bound Trading and Breakout trading etc.


Read more ...

Monday 9 September 2013

Ichimoku trading strategy

Ichimoku Kinko Hyo-Equilibrium chart at a glance

Ichimoku Kinko Hyo is one of the famous trend trading trading system that has been successfully used in nearly every tradeable market. It is unique in many ways, but its primary strength is its use of multiple data points to give the trader a deeper, more comprehensive view into price action. This deeper view, and the fact that Ichimoku is a very visual system, enables the trader to quickly discern and filter "at a glance" the low-probability trading set ups from those of higher probability.

There are 5 basic components in this system:

- TENKAN SEN (turning line)

(HIGHEST HIGH + LOWEST LOW)/2 for the past 9 periods

- KIJUN SEN (standard line)

(HIGHEST HIGH + LOWEST LOW)/2 for the past 26 periods

- CHIKOU SPAN (lagging line)

CURRENT CLOSING PRICE time-shifted backwards (into the past) 26 periods

- SENKOU SPAN A (1st leading line)

(TENKAN SEN + KIJUN SEN)/2 time-shifted forwards (into the future) 26 periods

- SENKOU SPAN B (2nd leading line)

(HIGHEST HIGH + LOWEST LOW)/2 for the past 52 periods time-shifted forwards (into the future) 26 periods

The area between senkou span A and B making the KUMO ( the cloud)


Basic signal

The Kumo indicates the derection of the trend and the big supports and resistances.
Tenkan and kijun crossover generate the entry signal.
Chikou span messures the momentum of the trend.

+ Strong signals - A strong buy signal occurs when the Tenkan-Sen crosses above the Kijun-Sen from below. A strong sell signal occurs when the opposite occurs. The signals must be above the Kumo.

+ Normal signals - A normal buy signal occurs when the Tenkan-Sen crosses above the Kijun-Sen from below. A normal sell signal occurs when the opposite occurs. The signals must be within the Kumo.

+ Weak signals - A weak buy signal occurs when the Tenkan-Sen crosses above the Kijun-Sen from below. A weak sell signal occurs when the opposite occurs. The signals must be below the Kumo.

+ Overall strength - Strength is shown to be with the sellers if the Chikou Span is below the current price. Strength is shown to be with the buyers when the opposite is true.

+ Support/resistance levels - Support and resistance levels are represented by the presence of the Kumo. If the price is entering the Kumo from below, then the price is at a resistance level. If the price is falling into the Kumo, then there is a support level.

+ Trends - Trends can be determined by simply looking at where the current price is in relation to the Kumo. If the price stays below the Kumo, then there is a downward trend (bearish). Alternatively, if the price stays above the Kumo, then there is an upward trend (bullish).
Read more ...

Sunday 8 September 2013

Dealing desk, no dealing desk forex trading platform

The types of the forex trading platform.

The first step when you want to get in the forex market, you must find a broker providing services. So you must find your selection criteria. The are 2 types of brokerage firm: Dealing Desk and No Dealing Desk . Dealing Desk also known as the Market Maker, while the No Dealing Desk can be subdivided into Straight Through Processing ( STP ) and the Electronic Communication Network + Straight Through Processing ( STP + ECN ).

Dealing desk brokers 

Dealing desk forex broker make money through spreads (bid, ask price) and the opposite transactions for their customer. You may think that there is a conflict or a fraud, but really is not. The maket maker offer the reasonable bid and ask price, they can adjust them to protect themself when the market  widely fluctuates,can be understood that they are not affected with purchasing decisions of customers.
The prices were controlled by market maker, the customer can't see the real price of the interbank market.But you do not need to worry, the competition among the brokers are fierce so if the exchange rate offered by Dealing Desk incompletely equal in interbank market, but there is just only a very small difference deviation .
When broker gets the order they start trying to find an appropriate order from a customer or through other liquidity providers , is a large organization is willing to buy or sell a financial asset .However, in the absence of appropriate transactions to match , they will have to get the opposite of your transactions and from this point of interest between you and the brokerage company will also conflicting . Please note that brokers have different risk management policies vary, so please check your broker about this .

No Dealing Desk brokers

As the name suggested , No Dealing Desk forex brokers move the customer's oders straight through the system to the liquidity provider (Investment banks, hedge funds, mutual funds, other brokers, other clients).
The brokers build bridge linking together and making money through spreads, using STP or STP+ECN system they can get the best price for their customer.
The spreads they offer are ordinarily lower than dealing desk brokers but the fluctuations are depended on the situations of the market at the specific time.
Read more ...

Heiken ashi MTF indicator

You want to analyse multi time frame with heiken ashi chart, but just want to see it on an only chart. you can use this indicator. there are many setting options on it

The default setting is :

 TimeFrame1 = "Current time frame";
 TimeFrame2 = "next1";
 TimeFrame3 = "next2";
 TimeFrame4 = "next3";
 MaMethod = MODE_SMMA;
 MaPeriod = 6;
 MaMethod2 = MODE_LWMA;
 MaPeriod2 = 2;
 UseHAHighLow = true;
 UniqueID = "4 Time frame HA";
 LinesWidth = 0;
 LabelsColor = DarkGray;
 LabelsHorizontalShift = 5;
 LabelsVerticalShift = 1.5;

Here is the image of it:


As you can see it indicate the 4 timeframes heiken ashi smoothed, if you just want the heiken ashi candle, you can modify the moving average period at 1.
download the indicator at here: 4mtf heiken ashi
Read more ...

Double BB MACD divergence trading

This stratey use 2 bb macd indicator, one for messure the power of current trend , one for making entry point decision. it generate both normal divergence and hidden divergence, but before making the decision you must specify the market situation that is trending or sideway that is the most important element in trading.

Both of 2 indicator can generate the signals, you can use other oscillator indicator with the same idea of divergence trading.

For example below I use 2 indicator on heiken ashi chart:


You can find many situation like this when market is running, waiting for the close of the candle and then get in. The normal divergence indicate the reversal at the big support and resistance, hidden divergence indicate the continuing of the trend, but it must appear on the way of that trend you are identifying.You can get 2 indicators in my indicator collections:

BB Macd nrp smoothed

BB Macd.ex4

Hope some one like this!
Read more ...

Friday 6 September 2013

THE POWER OF DOING NOTHING IN FOREX

I will show you why doing nothing is surprisingly powerful in trading.

This simple exercise had a profound impact on how I will try to manage my trades in future. Once I open a trade and I�ve got my stop to break even its time to do nothing, just walk away.

Obviously the vast majority of my trades would have been stopped out at break even however the small percentage that survived were taken by the long term trend and became little profit pulling machines! To give you an idea of the power of doing nothing lets take just one trade from the EURUSD. I entered this short sell trade back in January 2010, it was a simple trend collapse breakout trade risking 35 pips (2% of my account) and I took profit at around 95 pips. Which is not bad right? I risked 1 to get almost 3. (see details of the move at end of this post)

Now lets take a look what happened if I did nothing. The Daily trend took this trade and it never came back to hit my break even stop. In June 2010 it hit a maximum profit of 2410 pips and if it wasn�t closed it would be sitting right now at 1250 pips. Realistically I believe any long term sell positions on the EURUSD would have been closed the moment the head and shoulders pattern played out on the daily chart at the end of June. This would have closed the trade with a profit of about 1800 pips.

Now here is the shocking part!

Remember that the initial risk on this trade was 35 pips, which was equivalent to 2% of the trading account.Closing the trade at 1800 pips would have resulted in a gain of 102.8% on the account! Remember, this is just one trade!

Obviously this doesn�t account for some losses also taken during that period. But to give you an idea of the power of doing nothing lets take the worst possible scenario. Lets say I�m the unluckiest trader alive and after that trade I lost every single trade I took on the EURUSD to date. My account would still be sitting at a gain of 56.8%! Thankfully I�m not the unluckiest trader alive and that trade was just one of many positions that that would have survived the trend fluctuations without being taken out at break even.

Keep in mind this is only on one pair!

Ok, so back to reality� It would be great to trade this way and I am confident that if I just took trades, moved to break even and then did nothing I would be a more profitable trader. Unfortunately I am human and having trades close at a loss or break even for weeks on end would be extremely difficult to cope with. A logical solution would be to split your positions into two. One half would be treated as normal and closed at your usual target resulting in a nice small gain on your account. The second half would be set at break even and left to hopefully catch a ride on the long term trend. Using this method in my example above that one trade would have still netted over 51%!

Hopefully this has given you the push to do some testing of your own but in the end it just boils down to an old, but very wise quote�

�Cut your losses and let your profits run�

(see details of this move posted in Apr 2010 by a former MIGBANK Researcher here Euro Crisis)
Read more ...

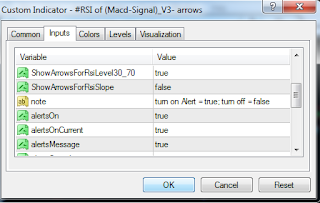
RSI MACD alert indicator.

This indicator measure the power of MACD by using RSI method to get the indicator that more smoothed, faster and accuracy signal.

Like the other oscillator indicators, it measure the power of the trend, giving the slope up, slope down signal, signal alert at 30-70 level and divergence signal indicate the retracement or the reversal signal of the trend.

MACD setup (24,48,9) RSI (5).

You can set up alert sound on it.


you can download the indicator  right here: RSI MACD, or you can find it on my forex indicator collections: http://anzforextrader.blogspot.com/2013/04/forex-indicators-collection-1.html
Read more ...

Thursday 5 September 2013

US dollar index ( ICE dollar index and CME dollar index)

At this time there are 2 versions of  US Dollar Index, the indicator indicates the statistics and overview of the forex market.

CME US Dollar Index

Dow Jones CME US Dollar Index futures shall be settled by physical delivery at termination to a Special Quotation of the Dow Jones CME FX$INDEX calculated using the final settlement price of expiring CME Euro /U.S. dollar futures, CME Japanese yen /U.S. dollar futures, CME British pound /U.S. dollar futures, CME Swiss franc /U.S. dollar futures, CME Canadian dollar /U.S. dollar futures and CME

The Dow Jones CME US Dollar Index is weighted and calculated as follows:


Where Units equals 4 in the case of CME Euro /U.S. dollar futures; 2 in the case of CME Japanese yen /U.S. dollar and British pound /U.S. dollar futures; and, 1 in the case of CME Swiss franc /U.S. dollar, Canadian dollar /U.S. dollar and Australian dollar /U.S. dollar futures. Size refers to the trading unit of each of the six Index constituents, e.g., the trading unit for CME Euro /U.S. dollar futures is 125,000 Euros, the trading unit for CME Japanese yen /U.S. dollar futures is 12,500,000 yen, etc. Price refers to the price of each of the six Index constituents, e.g., CME Euro /U.S. dollar futures may be at $1.3595 per Euro; CME Japanese yen /U.S. dollar futures may be at $0.010901 per yen, etc. The Dow Jones CME US Dollar Index may be calculated as 144.7330 in the example illustrated below.


Dow Jones CME US Dollar Index = Basket Value � $10,000 = $1,447,330 � $10,000 = 144.7330
you can get more information on CME rule book.

ICE US dollar index

The ICE US dollar index (USDX) is a geometrically-averaged calculation of six currenciesweighted against the U.S. dollar. The U.S. Dollar Index was created by the U.S. Federal
Reserve in 1973. Following the ending of the 1944 Bretton Woods agreement, which had
established a system of fixed exchange rates, the U.S. Federal Reserve Bank began the
calculation of the U.S. Dollar Index to provide an external bilateral trade-weighted average of
the U.S. dollar as it freely floated against global currencies.
The formula is:


Sources: CME and ICE book.

Read more ...

DEMA smoothed moving average indicator.

DEMA indicator developed by Patrick Mulloy that first appeared in the February, 1994 Technical Analysis of Stocks & Commodities.
It's based on both a single exponential moving average (EMA) and a double EMA.
The fomula of it is:
Dema indicator formula
The idea of this method like MACD histogram, smooth the moving average 2 times to get a new indicator lesser lag than either of the original two.

You can see it on this chart:


As you can see on this chart (DEMA set up 21 and 13) , this indicator are faster and get less fail signals than the other type of moving average. You can compare it with other moving average by yourself.
You can find the indicator by searching my indicator collections.
Read more ...

Wednesday 4 September 2013

Metatrader terminal 4 (MT4) with custom indicators and Experts with templates Free download

MT4 terminal free download With experts,indicators and templates 

 Indicators Include :

A snap shot of Harmonic Indicator :)
This is Just One indicator Working Fine , And it always DO :)


  1. Auto pivot
  2. Breakout asian session 
  3. MTF moving average
  4. Spud fibo
  5. Super Woodie CCI
  6. WSS indicators
  7. TSR Big trend
  8. TSR signal line
  9. ACD 2,3
  10. DYN all levels
  11. Pivot all lines
  12. TRO dashboard
  13. Zero cross alert (CCI)
  14. JRSX
  15. Better Murray math mm levels
  16. ABL
  17. Advanced ADX
  18. Aroon
  19. Aroon up and Down
  20. Aroon bars
  21. Aroon horn
  22. Aroon oscillator
  23. ASC trend
  24. ASI
  25. ATR levels
  26. ATR mod
  27. ATR stop loss
  28. Auto day fibo
  29. Auto Pivot points
  30. Auto pivot plotter
  31. BB_MACD
  32. Bollinger bands MACD
  33. Bollinger bands %R
  34. Bollinger Squeeze
  35. Brain trend
  36. Brain trend indicators all included
  37. Brain trend stop line
  38. Breakout
  39. Camarilla 
  40. Camarilla DT (Best indicator )
  41. CCI divergence
  42. Chaikin's Volatility_Kalenzo
  43. Channel ZZ
  44. CK_Speed
  45. Clock
  46. CMF correct
  47. Cowabunga
  48. CZigZag
  49. Cynthia's_Triangle_Breakout
  50. DayImpulse2DD
  51. DayImpulseOverlay
  52. DeMark Trendline Trader
  53. Divergence_MACD_FX5_V1.1
  54. Divergence MACD
  55. Donchian Channels
  56. Donchian
  57. DoubleCCI-With_EMA
  58. DoublecciWoody
  59. Dserg-LinRegressionBreakout_v1.1
  60. DT_ZZ
  61. EJ_CandleTime
  62. Elemental Trader v1.5
  63. Elemental Trader v1.6
  64. Elemental_mq4
  65. Elliott Wave Oscillator
  66. EMA Crossover Signal
  67. EMA_CROSS_IND
  68. e-Regr
  69. FerruFx_Multi_info THV
  70. FerruFx_Multi_info
  71. FF Tunnel Chart
  72. FFCal
  73. Fibo Extensions
  74. Fibos_v5
  75. FX ElliotWave
  76. FX Snipers Ergodic CCI Trigger EA v2
  77. FX_Sniper's_Ergodic_CCI_Trigger_(SRDC)
  78. FX5 Divergence v3
  79. FX5_FiboSpiral_v1.0
  80. Gann HiLo activator bars
  81. Gann Hi-lo Activator SSL
  82. Gartley Reversal Auto
  83. Gartley
  84. GMACD
  85. goldminer2
  86. HamaSystem
  87. Harmonic 0_Harmony_06
  88. Harmonic web
  89. Harmonic ZUP_v20
  90. Harmonic Pattern Trader
  91. Heiken Ashi
  92. Heiken_Ashi_Smoothed
  93. HeikenAshi_DM
  94. i-CAi
  95. ind_RSIColored_v1
  96. Ind-GG01
  97. Ind-Murrey_Math_MT4_VG-1
  98.  InstaForex_MT_Desk
  99.  iPanel_Indicators
  100.  i-ParamonWorkTime
  101.  i-Regr
  102.  Keltner Channels
  103.  Keltner_Band_MAHiLo
  104.  Kuskus_Starlight
  105.  London BreakoutV9.1
  106.  London BreakoutV9.2
  107. MA rsi
  108. MACD_Divergence_V1.1
  109. MACD-LSMA
  110. McGinley Dynamic Indicator
  111. Mint signal 2
  112. MMLevls_VG
  113. Murrey_Math_Lines
  114. OsMA
  115. Parabolic Sub
  116. Parabolic
  117. Pattern Recognition (Best )
  118. Pattern_Recognition_Master_v3
  119. PipTurbo_V1.0~
  120. Pivot-Calculator
  121. PPO
  122. Price Channel
  123. RainGull Spectrum
  124. PriceChannel_Stoploss_v1.2
  125. RenkoLiveChart_v2.1
  126. reversals
  127. RIDI_LEVELS_MT4
  128. rsi chart bars
  129. SDX All indicators included
  130. SnakeBorders
  131. SnakeForce
  132. Sniper_Trend_B
  133. Sonic CCI
  134. Spread
  135. stochRSI ( Stochastic RSI)
  136. Support and Resistance (Barry)
  137. SynergyInd
  138. TA_1.14b
  139. TanganJiwa
  140. THV4 InfoPanel
  141. time to next bar (Very useful for Scalping)
  142. Traders_Dynamic_Index
  143. TraderWawasan Bands
  144. TraderWawasan All Indicators
  145. Trix
  146. TRO_Multi_Meter_Control
  147. TRO_Tunnel_dragon
  148. VHF_v1
  149. Waddah Attar Monthly Fibo
  150. Waddah Attar Weekly Fibo
  151. WcciPaterns (Very Good indicator)
  152. WolfeWave 1
  153. WolfeWave 2
  154. WolfeWave 3
  155. X-MM-Math
  156. WSS95-BARS
  157. XprofuterOverlay
  158. ZigZag_Fibo_v1beta
  159. ZigZag_new_nen3
  160. ZUP_RSI_v48 ( RSI Harmonic patterns indicator)
  161. ZUP_v60 (Harmonic patterns Indicator)
  162. ZUP_v64 (Harmonic pattern Indicator)
  163. zwuk MA
  164. ZZ-Fractal A

Expert Advisors EA (Robots) Include :(Download)

  1. 5034_alert
  2. 5034_trade_v1(CCI Best system)(Robot)
  3. ADX Crossing EA
  4. ADX Simple
  5. ADX_System
  6. Alpha9v1.19
  7. Always in play
  8. ArtificialIntelligence
  9.  ASC-Trend-signal
  10.  ATR Mod
  11.  ATR_TREND
  12.  BABYPIPS_SYSTEM
  13.  BEARS_BULLS_EA_SIMPLE
  14.  Breakout Expert
  15.  Breakout Genius v03b
  16. Candle Stick Pattern Auto Trader v1.00
  17. CCI Cross Grid
  18. channel_scalp_V2
  19. CyberiaTrader
  20. Dragonpip_V4_extreme_universal 
  21. Daily Scalp
  22. DigFiltr
  23.  DoubleUp2
  24. DivergenceTrader_v06
  25.  Dragonpips Hyper Trade
  26. DragonPips Ultimate_v.2.02
  27. Dragonpips_Final_Educated_v.2010
  28. dragonpips2010_final_EXTREME v3
  29. e-3stoch_299
  30.  e-BrainTrend
  31. Elliott Wave Trend
  32. elemental_EA
  33. Elliott Wave Trend
  34. EMACross
  35. e-man123_203
  36.  e-Regr
  37. Expert+10
  38. FapTurbo52
  39. FapTurbo
  40. FFCal
  41. FidgetExp
  42.  Firebird v065tf
  43. FOREX Combo System 1.46
  44. ForexDerivative Ori
  45. Fractals_Z
  46.  FX Snipers Ergodic CCI Trigger EA v2
  47.  FXCM_2MA_Crossover&ADX
  48.  FXCM_ATR_Trending_System
  49.  FXCM_Bollinger_Trending_System&ADX
  50.  FXCM_ParabolicSAR&ADX
  51.  FXCM_ParabolicSAR_Gator
  52.  FXCM_RSI_Crossover&ADX
  53.  FXCM_RSI_Oscillator
  54.  FXPROMAKER v2
  55.  FXPROMaker_Advanced_all_pairs_demo_20.12
  56.  FXPROMaker_Advanced_eur_gbp_scalping_demo_20.12
  57.  FXPROMaker_Advanced_usd_jpy_aggressive_demo_20.12
  58.  FXPROMaker_Advanced_usd_jpy_default_demo_20.12
  59.  GaoXing Daily Breakout v1.4
  60.  gaps (works good on 4 Hour chart)
  61. GBP_%MIN_STOCH
  62.  gbp_1m Scalper (My personal)
  63. GBP_5min Scalper
  64. GBP_JPY_SCALP_1M
  65.  GBP_JPY_Scalp_v2 (My personal Good one)
  66.  GBPJPY EA scalper (Good one)
  67. GEPARD 2.3 EA
  68.  GEPARD2.5 EA
  69.  GEPARD3.1 EA
  70. Godbot
  71.  GoodG@bi
  72.  Graal-FxProg_team
  73.  Graal-FxProg_team
  74.  GroodgeEA_v1.16
  75.  GroodgeEA_v1[1].13
  76.  Hans123MV1.2 (HANS Trader EA)
  77. Hans123MV1[1].1
  78.  Hans123Trader_v4
  79.  HarmonicExpert_v1 9Harmonic pattern Expert)
  80. Ichimoku EA
  81.  Ichimoku_scalp_1m
  82.  Ichimoku_scalp_v2
  83.  ichimoku_trading_strategy_1
  84.  Ichimoku5
  85.  iliaaz_EA
  86.  InputResizerEA
  87.  james_bond-1_289
  88.  GBP_JPY scalper (JPY_GBP)
  89. GBP JPY Scalper 2 (JPY_GBP_2)
  90. Keltner Channels
  91.  KI EA v1.0.2
  92.  LiveAlligator 101
  93.  LiveAlligator 101a
  94.  LSMA_Daily
  95.  MACD_signal.mq4
  96.  MagicEA_Demo
  97.  MDPro_v101ee_bbr_v11_N1
  98. MagicEA_Demo(2)
  99.  MDPro_v101ee_bbr_v11_N1
  100.  MegaDroid
  101.  MegaDroid_v121_nodll
  102.  MMR
  103.  Momentum Grid
  104.  momentum_scalp_v1
  105.  moneymaker v2 EA
  106.  Moving average_scalp
  107.  moving average_scalp_v2
  108.  MovingAverage_scalping
  109.  MRN Bot
  110.  MT4-FST Expert
  111.  nemox_881
  112.  nemox-0001_133
  113.  One_in_Day1
  114.  Opto123 EA v1.1
  115.  osma_5min
  116.  Phoenix_EA_v5_6_03
  117.  Pips_Miner_EE
  118.  PipSpool~
  119.  PipTurbo_V1.0~
  120.  Pivots_Daily
  121.  Pivots_Daily_Medians
  122.  RainGull Spectrum
  123. Renko Trader V-5
  124.  Robot_Forex_2015_Profesional_Real
  125. Robot Forex 2015 Profesional Demo
  126. RSI EXpert
  127. RSI Grid
  128. Rsi+momentum=5Min
  129. SAR Sample_2
  130. Scalp_1M
  131.  Scalp_net_v1.3.2_tf
  132. Scalp_net_v1.3_tf
  133.  scalpexp03all_ver24_210
  134.  SDX-Tz Breaktout EA
  135.  Session breakout v0.26 EA Download
  136. Sig CCI
  137.  Simple EA ii
  138.  Simple moving average EA
  139.  SMSalert EA (Good)
  140.  Stocheurusd
  141.  StochScalp^^2^^
  142.  SuperForexV2
  143.  The Channel Scalper 1.10
  144.  The Channel Scalper 1.06
  145.  The Channel Scalper 1.13
  146.  The Theory of Cycles
  147.  TheMasterMind3
  148.  TradeChannel
  149.  tradechannel2_638
  150.  TrendMaster EA
  151.  UF_Pivot_Lines
  152.  VolatilyScalp (Volatility Scalper EA)
  153. VS_EURCHF D_01
  154.  VS_EurGbp_F01
  155.  VS_EUROCROSS D_05
  156.  VS_EUROCROSS_D05_NonFFCal
  157.  X-Wave-(21-13-8-1)
  158.  ytg_Level without the loss
  159.  ZeusFX-EURUSD-Master-V1.1
  160.  ZeusFX-GBPUSD-Master-V1.1
  161.  Zmei_trader

Templates Included :

  1. winning-solution-95-expertadvisors
  2. winning-solution-943-actual-trend1
  3. winning-solution-943-actual-trend2
  4. winning-solution-943-actual-trend3
  5. winning-solution-943-backtest
  6. winning-solution-943-expertadvisors
  7. winning-solution-943-pyramidea
  8. winning-solution-943-trend3ea
  9. winning-solution-943-wave
  10. winning-solution-new-943-actual-trend1
  11. winning-solution-new-943-actual-trend2
  12. winning-solution-new-943-backtest
  13. winning-solution-new-943-ea
  14. winning-solution-new-943-news-alert
  15. winning-solution-old-93-actual
  16. winning-solution-old-942-actual
  17. winning-solution-old-942-backtest
  18. 1m_eur_usd_ststem
  19. 1m_eur_usd_system_support-resistence
  20. 2
  21. 2_elemental
  22. 2_small
  23. 2_v2
  24. 5014_
  25. 5034_newtrend
  26. 5034_v2
  27. 5034_v3
  28. background
  29. background_main
  30. background_orignal
  31. best_5min
  32. Bolinger_jpy
  33. breakout trading
  34. breakout_change
  35. breakout_new
  36. daily
  37. dance_d1
  38. dance_m5_h1
  39. dance_m15
  40. elemental
  41. finaltemplate1minute
  42. finaltemplate5minute
  43. Forex Profit System
  44. fx trend tracer
  45. gbp_5min
  46. gepard ea
  47. keltner bb breakout
  48. kosongan
  49. ma_
  50. mdpro_ea
  51. momentum_1
  52. momentum_trading
  53. my wss 9.5-ea
  54. my wss 943 actual trend 1
  55. my wss 943-ea
  56. my wss v9.4.3 fv on GBP M30
  57. range_trading
  58. SharkD1_-_The_Best_Manual_Trade_Way_
  59. sonicr - with fibopivot
  60. sonicr - with spudfibo
  61. ssi Indicator
  62. ssi
  63. ssi EA 
  64. ssi_v2
  65. trendpipper v2
  66. vs_eurchf d_01
  67. william %r
  68. Williams
  69. scalp (Scalping template)
So Thats It , I Hope u will enjoy The indicators Download , Templates and Expert dvisors download

My personal Strategy template and indicators with EA are also included in the Package.

Using this Metatrader terminal 4 You will definitely Learn some New things , And make your equity Higher.

By using sme good Templates and making your own in this package you can Make Thousands of dollars Daily For FREE .
DOWNLOAD MT4 with Indicators, Expert advisors and Templates (CLICK HERE)
If you wnt free Signals That work more than 70 % of the time having bet success rate then Check our signals Website Here : Free Forex and Gold signals
Happy Trading and Pipping :)


Read more ...

Tuesday 3 September 2013

COT report, open interest. Solution for the volume in forex market

There are 3 important elements in trading, they are: price, volume, and time.

In other market like listed stocks exchange, we can get the volume transaction in a day through the information systems of broker and floor exchange, in the OTC market like forex market, we can not statistic the volume exactly, the volume that broker provided, it just for reference, in MT4 platform the volume is just the tick volume, and it will be different with the other brokers. One of the alternative solutions for this problem we can use the COT report to get the informations that the investors is going to do in furture and option market.

We can get the COT report at Commondity trading commission website: http://www.cftc.gov/MarketReports/CommitmentsofTraders/AbouttheCOTReports/index.htm
Here is the example:


Detail:

Commercial
- Describes an entity involved in the production, processing, or merchandising of a commodity, using futures contracts primarily for hedging

Long Report - Includes all of the information on the "short report", along with the concentration of positions held by the largest traders

Open Interest - The total number of futures or options contracts not yet offset by a transaction, by delivery or exercise

Noncommercial (Speculators) - Traders, such as individual traders, hedge funds and large institutions, who use futures market for speculative purposes and meet the reportable requirements set forth by the CFTC

Nonreportable Positions - Long and short open-interest positions that don't meet reportable requirements set forth by the CFTC

Number of Traders - The total number of traders who are required to report positions to the CFTC
Reportable Positions - The futures and option positions that are held above specific reporting levels set by CFTC regulations

Short Report - Shows open interest separately by reportable an non-reportable positions
Spreading - Measures the extent to which a non-commercial trader holds equal long and short futures position

you can see the COT indicator combine with chart in this website: http://www.timingcharts.com
Read more ...