Friday 30 August 2013

Best BB MACD with kijun envelope trend H4 Strategy

H4 Strategy
This Strategy using kijun envelope to identify the trend with 2 band envelope.
The rule is like other trending system, the trend is friend, we will wait for the trend indicate itself, then specify the entry point. The trend is up when kijun and 2 band are moving upward, the trend is down when kijun and 2 band are moving downward.
Using the BB_MACD indicator to get the signal, red dot for the bearish signal, and green dot for the bullish signal.
You can see it in the chart below:


The good signal is the change of BB MACD color with the price is close to the kijun line. BB MACD is one of the best leading momentum indicator, be careful when the divergence appear.
You can find another version of MACD in my indicator collection.
Kijunsen envelope indicator.
Thanks for Reading.
Read more ...

Trend line and divergence breakout signal.

At this time, there are many ways to use the oscillator indicators to mesure the market momentum and identify the entry signal, it has been used in many trading strageties, one of them is trend line breaking signal.

The rules is very simple:

The indicator indicates the divergence, it's mean the current trend is slowing down, then waiting for the break of the current trendline, this rule applys for both up and down trend. Remember this signal can be the big retracements or the reversal, see the bigger trend to make the best decisions.


You can get the indicator a here: ADXm
Read more ...

Tuesday 27 August 2013

Trending and sideway identifier

There many way to identify the situation of the market, here is one of  the best idea to identify the market is trending or sideway:

we using the bollinger band and keltner channel, if the bollinger band is inside the keltner channel , it's mean the sideway situation. Contrarily, The market is in trending situation.

This idea was used in BB squeeze indicator, you can see in this image:


you can modify the indicator, with many options.
Read more ...

Candle stick identifier indicator

There are many kind of candle stick type, you are confusing with it. This indicator will help you solve this problem. It can be used in many system like trend trading, or divergence trading system.

you can get it in there:

Candlestick - Candlestick Identification_MT4_In

Candle stick patterns
It can identify many pattern like : engulfing, harami, doji, dark cloud cover...
Don't use it alone, combine with identifying the trend, and get the entry.


Read more ...

Elliott wave trading strategy

This strategy using Elliott wave oscillator to identified the trend and courting the Wave. The biggest move of the oscillator is the 3rd wave. The divergence at the wave 3 and the wave 5, it will be the next A B C sequences, or the reversal.

Indicator:

Elliott Wave oscillator.mq4
Juice.ex4

you can find it on my indicator collections.

Elliot wave oscillator
Buy when EWO upper zero line, and sell when it under zero line
Just make decision when juice indicator upper 0.0004.
Read more ...

Keltner channle with CC_divergence

This stragety using keltner channel to identify the situation of the trend, and using CC_divergence to get the entry point. It's useful for every major forex pairs. H1 stragety.

 Detail:

cc_Divergence.ex4
KeltnerChannel_v1

Long entry rule:

buy when keltner channle up, and cc_divergence up, stoploss below the closest swing point adding spreads.

Short entry rule:

Sell when keltner channle down, and cc_divergence down, stoploss below the closest swing point adding spreads.

Notice: the divergence appare it's mean the huge retracement or the reversal.

keltner channle with CC divergence


Read more ...

Friday 23 August 2013

HIGH PROBABILITY DIVERGENCE SETUPS

Welcome to the second part where I am explaining how you can use divergence with some tips and tricks I have learnt over the years to pinpoint market turning points with high accuracy. 

In the part 1 (price swing prediction) we discussed standard divergence and what to look for with your preferred indicator to spot this setup. Now its time to dig a little further and see how deep the rabbit hole goes! 

High Probability Divergence Setups!

Through years of trial and error I have discovered what works and what does not. Divergence by itself is a bit hit and miss, you never really know if the divergence will play ball or not. This is probably why many traders give it a try then decide to leave it for something 'supposedly' better. Sadly, they didn't know how close they were to the pot of gold!

By combining divergence with some simple price action tools we can turn that hit and miss setup into a very accurate entry technique.

Before we go into these tools, let me show you my absolute favourite type of divergence. I call it the DTD & DBT (double top divergence / double bottom divergence). This type of divergence has pinpointed trend reversals more times than I can remember. All you are looking for is a double top or double bottom in price then for your preferred indicator to also show strong divergence. 

Below is an example of a DBD on the GBPUSD 4H chart, this setup captured a 700 pip trend reversal! In all examples below I am using RSI indicator set to 6 for divergence.
I know what you're thinking, that was cherry picked and just a one off right? Wrong, these setups happen all the time across all pairs, in fact lets take a look what happened at the end of the 700 pip move shown above.

Yep you guessed it another DTD which again captured a trend reversal of almost 900 pips!
The reason DTD and DBD setups are so powerful is because they combine confluence of support or resistance into the setup. In order to have similar success with standard divergence you will need to be extra picky about the setups you choose. Look for setups that happen as price is coming up against strong areas of support or resistance.

Timing Your Entries!

Entry's can be tough because most entry techniques are lagging and therefore get you into the move late eating into your potential profits. But don't worry, I am going to show two price action entry techniques I use all the time with astonishing success trading divergence setups.

Once I have a DTD/DBD or standard divergence with strong confluence I start watching price action at the close of each new candle. I am waiting for one of the two candle formations below to clearly appear. 
Once the candle formation forms and the candle has closed (very important) I enter at market with stops above/below the candle formation.

If you take another look at the two setups above on the GBPUSD you will see that both setups triggered with an engulfing candle formation! A fluke? Nope, this happens all the time :-)

Ok, so that's part two of this mini divergence course over and done with hopefully it has provided you with some new tools to add to your trading toolbox. Remember, the key to success is to be picky, wait for strong confluence to line up or better still a DTD/DBD setup.

We are not done yet though,  Follow me
over the next few days for more awesome divergence tips and tricks.
Have fun & good trading!
Read more ...

Sunday 18 August 2013

BANK TRADER REVEALS BREAKOUT STRATEGY

Hello traders,

Today I would like to show you a technique that is valid for all currency pairs and all time frames (my group in the bank tend to use it mostly on the Daily and Weekly charts to avoid market choppy noise). The name of this strategy is the Breakout, Congestion and Continuation pattern, and it�s a high probability setup given the right circumstances. If you master this technique, you could achieve a 75% to 80% win/loss ratio!

The key concepts are the universal pattern of any currency pair : continuation pattern after a strong momentum breakouts of key Support / Resistance levels, using candlestick formation made by 3 consecutive candles.

Search for the pattern only upon the breakout of a significant horizontal level of support / resistance 

The pattern : You must see a solid breakout candle breaking through the Support / Resistance level

Don't trade if you get "shaky" breakout candles

Trade only when you see one small candle beyond the support / resistance level, then place your stop orders as shown below

Close 50% of the trade at the close of the first continuation candle, then move stoploss to break even.

Finally, close remaining 50% of the trade at the close of the second continuation candle.

There is 75%-80% winning ratio if you follow this strategy. Good luck !

Read more ...

Saturday 10 August 2013

HOW TO PREDICT PRICE SWINGS IN ADVANCE

Have you ever wished you had an indicator that would predict a price swings in advance? Well chances are you already do, it's just that you have yet to discover how to harness its power. 
Confused? Don't worry it will become clear! 
I'm not a big advocate of indicators, I do use some common indicators in my trading but all indicators have a major flaw when it comes to trade entries. Indicators follow historic price and consequently are always lagging behind price. However there is a technique to use selected indicators in relation to price structure, which can give you an accurate leading indication of when price will turn! 
I am of course talking about Divergence. I know divergence is no big secret, but when used properly it is extremely powerful in predicting price swings. If you have never used divergence then you are in for a real treat. If you already use it then hopefully some of these tips and tricks will help increase your accuracy. Over the next 2-3 posts I will share with you what I have learnt from the many years of trading divergence setups. I have a tested a multitude of different indicators, entry techniques and time frames. I have discovered through backtesting plus trial and error what works and what does not. 
First things first, lets get the basics out of the way, once you have a grasp of the basics we will discuss some cool tips and tricks I use which will help you spot these powerful setups plus get in at the right time.
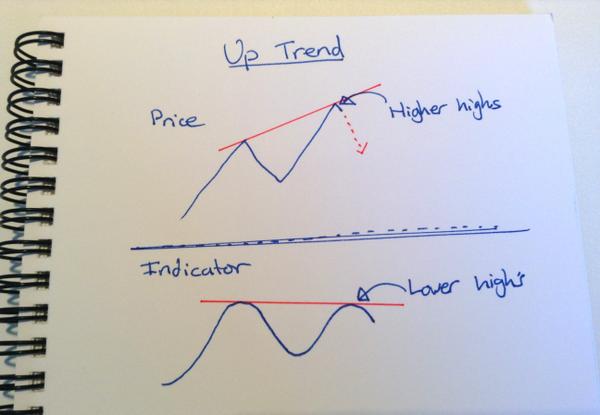
For standard divergence, we are watching the highs and lows of price in relation to the highs and lows of the indicator. In an up trending market we are watching the higher highs and waiting for the indicator to begin showing lower highs. In a down trending market we are watching the lower lows and waiting for the indicator to begin showing higher lows. 
Please see my crude sketches below for reference. :-)


The red doted price line indicates the expect direction of price due to the divergence setup.
What indicator should you use? 
Many oscillators will work fine for spotting divergence. Here are a few that I have used with great success.
- MACD (trigger lines or histogram) 
- Stochastic 
- RSI 
People tend to have their own favourites so have a play around and see what suits you. 
A high percentage of the time strong divergence can be a good indication that the current trend is over at least temporarily. So not only can you take advantage of the divergence swing you can also use it to manage trend trading methods. 
This stuff will work on any time frame but in my experience it is easier to spot on 4H and Daily charts so you may want to start there. 
In the next post I will show you another type of divergence which is extremely accurate and my personal favourite. I will also discuss some little tricks I use to help increase the accuracy of these setups even further. 
Your mission - should you choose to accept it, is to head over to your charts, go back over the history and start looking for divergence. Have a play with a few indicators and see which you prefer. 
Before I go I will leave you with one quick example of how powerful divergence can be when used properly. The chart below is a 4H chart of the EURUSD just before the huge trend reversal
Keep a close look out for part 2 (high probability divergence setups) of this series. Have fun & good trading! 


Read more ...

Monday 5 August 2013

RSI divergence Indicator and System

RSI divergence :

Download The RSI divergence Indicator From the link below :
RSI coloured indicator download

RSI divergence indicator download
  • Put the Indicator files In Metatrader folder Path :
    Expert/Indicators 
  • Restart the Metatrader terminal
  • Navigate to " Navigator " and then to " Custom indicators"
  • Drag Both Indicators to Chart and Drop 
The screen will look like this :
RSI divergence and RSi coloured Indicator

This indicator will tell you When a Divergene occurs On RSI .
And the second indicator Helps in The view of Regular RSI as peaks.


Read more ...