Tuesday, 3 June 2008

A useful directional oscillator

Have you ever looked for an indicator that could provide you with a broad indication of price direction? Well, here�s a nifty little indicator that could help.

It�s very similar to MACD but tends to suffer fewer whipsaws in flatter corrections. The basic concept behind the MACD indicator is instead of using the crossover signals of two moving averages to base signals, it assigns one (exponential) moving average to represent price and a second, longer (exponential) moving average to represent the underlying direction of price.

The problem with just using the crossovers of two moving averages is that the signals can come very late and much of the directional move can be complete when the signal is finally generated.

The MACD, by measuring the width between the averages, is more sensitive to how fast the averages are moving apart (divergence) and also how quickly they are moving together (convergence.)

The drawback of MACD is that it can be so responsive to changes in direction that it can provide a signal too quickly.

The challenge is therefore to devise an oscillator that will remain responsive but avoids some of the premature signals.

Therefore, what I did was use a linear regression average. While all averages have a lag due to the look back period the linear regression average tends to remove some of the lag and move closer with price itself.

What we could do as an indication is merely take the close price and deduct the value of the linear regression average. However, as you can see from the following image it produces a rather choppy result from which signals are not obvious or even useful.
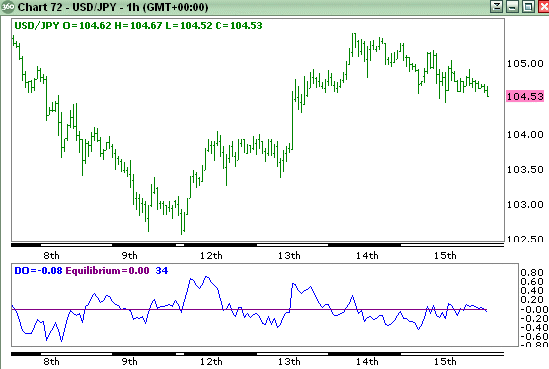
Raw Directional Oscillator

Therefore the challenge was to provide a signal that was more a reflection of the underlying direction. To achieve this I took an average of the linear regression average but to retain sensitivity I used and exponential moving average that gives more weighting to recent values. I used the same period for the exponential moving average as I did for the linear regression average.

Then to avoid whipsaws from price I used a 10 period linear regression average of price. Now, the result is far more useful�
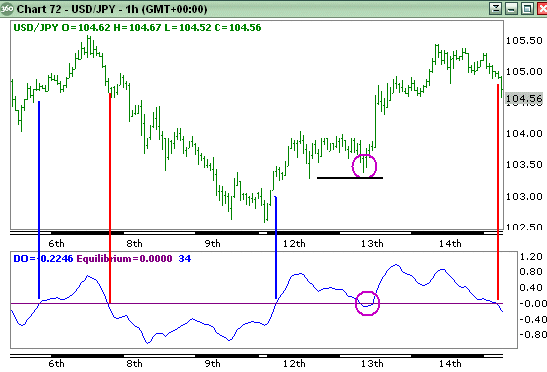
Smoothed Directional Oscillator

Basically using the crossover of the oscillator through the zero equilibrium line we can generate signals. Very clearly such simple signals are rather raw and we should at least use some basic common sense.

For example, to the middle right of the chart we can see a period of consolidation that caused the oscillator to drop below zero and then recover. When seeing this we should remember that using indicators blindly can make us ignore very simple rules.

We can see that price is consolidating and in these situations it is far wiser to trade on breaks. If price had fallen to break below the first corrective low then it would have been a stronger signal. Until that occurs we can still see that both highs are rising and lows are rising which indicates a potential uptrend.

We may choose to square a long position and then renter once a stronger signal has been generated. If the general trend in a larger time frame (this chart is hourly) we could choose to remain in the position. In this situation it would have paid off.

Good luck !

Read more ...

Friday, 9 March 2007

Multiple Time Frames combine with RSI and support/resistance

A technique to improve your trading decisions

Have you ever seen RSI overbought and wonder whether it was the right time to sell? Let�s face it, an overbought reading in a momentum oscillator can merely mean that price is strong and may even turn into an uptrend.

Is it a valid overbought signal? Do you sell? Where do you sell? Where should you place your stop?

Quite often using two charts of different time frames can help. For instance, let us suggest you have seen an overbought reading in the daily chart but there is no bearish divergence. What you can do is look at a shorter time frame chart, a 4-hour or 2-hour chart to see what is happening there an whether a more accurate sell signal can be identified. Let us look at recent example in EURUSD:

Daily EURUSD

Above is the daily chart of EURUSD as it approached 1.3258. Daily Rapid RSI was showing an overbought reading but there was no bearish divergence. From this chart alone we probably couldn�t work out whether there was a selling opportunity or not.

2-hour EURUSD

This second image is the 2-hour chart of EURUSD but here it can be seen that the peak at 1.3258 was accompanied by a bearish divergence in Rapid RSI. We are therefore on warning that a reversal can occur and that the daily overbought reading may well be correct.

Next we have to identify a selling level and in this case it is on the break of the price support line which has touched price four times before it finally breaks and this is where we can place our sell-stop. The money management stop should ideally be placed above the 1.3258 high but if this is too high and would cause a large loss then we can look at placing a stop above the rising trend line. However, do note that is a rising trend line and could mean that your stop needs to be raised to allow a possible retest of the line.

In this case the trade would have been very profitable with a decline down close to the daily pivot support which rests around 1.3050. A take profit order can be placed just above this to exit the position at a tidy profit.

Utilizing a lower time frame chart to identify when Bollinger support/resistance will hold

Following on from the first description of using multiple time frame charts to both strengthen your analysis and enable tighter entry and exit trades, let us take another look at using these in a different example.

Many traders like to use Bollinger Bands to try and identify entry signals. The problem I have always had with them is that they only provide approximate support and resistance which causes problems in knowing where you should enter and where the stops should be placed. Not only that but sometimes they just don�t seem to work at all as a support/resistance tool and the judgment of when they�ll work appears purely subjective.

Take a look at the daily chart of GBPUSD:

Daily chart with Bollinger Bands

In the center of the chart we can see that price has declined to the Bollinger low and on first touch it does bounce only to fall below the lower band and does so on three consecutive days. On the day before the absolute low Rapid RSI moves into the oversold extreme. Does this mean we can buy? Maybe. Sometimes it works and sometimes it doesn�t.

So what should we do?

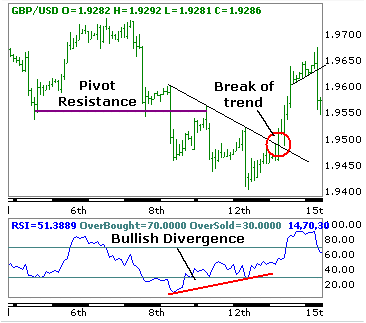
The following chart is the 2 hour chart showing the approach to the low at 1.9400.

Two hour chart

On the left of the chart we can see that price falls below two identical lows and these can then be considered as pivot resistance. We then see the three pushes lower and on the daily chart we know that the Rapid RSI went into an oversold extreme.

Do we buy at that point because is looks like the Rapid RSI on the 2 hour chart is developing a bullish divergence? The answer is �no.� Divergences should only be traded on a break of a pattern. In this case we have an intermediate downtrend line and it is only after the final low that price breaks above the trend line and thus confirms the bullish divergence in Rapid RSI. You will also note that following the break above the trend resistance that price reverses briefly to retest the trend line which provides a second buying opportunity.

Following the break of the trend line which was the day after the daily oversold reading price rallies by 200 points. That�s a good profit� Not only that, by waiting and observing the 2-hour chart you can avoid trying to pick the bottom as suggested in the daily chart.

Remember, it is normally best not to try and pick tops and bottoms as these will often provide losing trades. Waiting patiently for the right signal by fine-tuning the entry on a shorter time frame chart can reduce losing trades and make the final trade a more profitable one.

Good luck !

Read more ...

Monday, 23 October 2006

Moving Average Convergence and Divergence - avoid MACD pitfall in your trading

MACD is used quite widely among traders mainly, it would seem, because the basis for the indicator is something they can visualize � effectively measuring the degree of convergence or divergence of two exponential moving averages. Commonly traders will consider buying or selling on crossover of the MACD lines. However, there can be problems and it is worth understanding when these may occur.
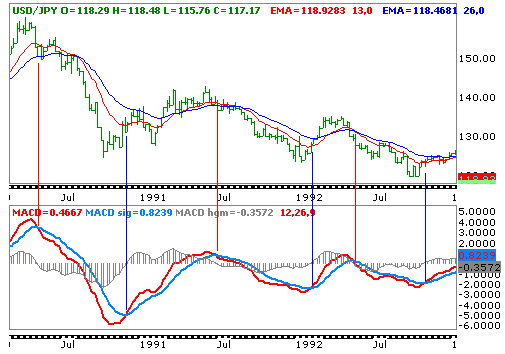
Let us take a look at the MACD plot on a weekly chart of USDJPY:
MACD 1
Broadly we would be pleased with the general signals being generated from MACD in this chart. While the crossover of the MACD across the signal line never really occur at market extremes, in this case they are pretty close and one cannot expect a lagging indicator to provide signals at price extremes.
It can be seen that before the moving averages cross the MACD is signaling a reversal earlier and allowing an early entry into a potential trade. Perfect. We can begin to trade on this indicator then� Or can we..?
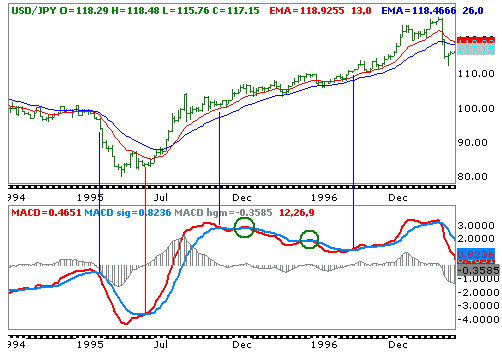
Take a look at the second chart, still the weekly chart of USDJPY but from a year or two later:
MACD 2
At first it looks quite good. MACD signals a sale into the large decline to the historic 79.70 low and a little later a reversal higher. There is lots of profit to be taken there. However, watch as the MACD peaks out soon after the initial rally from the 79.70 low. The two exponential moving averages continue to point higher and indeed do not cross lower until after the 147.65 peak. However, MACD spends around one year in a decline while price has continued to rally.
This is a recipe for losses.
Why is it that MACD can provide such a bad signal since it is based on two exponential moving averages?
The answer lies in the name: Moving Average Convergence and Divergence.
While the exponential moving averages are rising, the trend has slowed to the point that while only slightly the averages are converging � that is, moving closer together and this has caused the MACD to cross below the signal line.
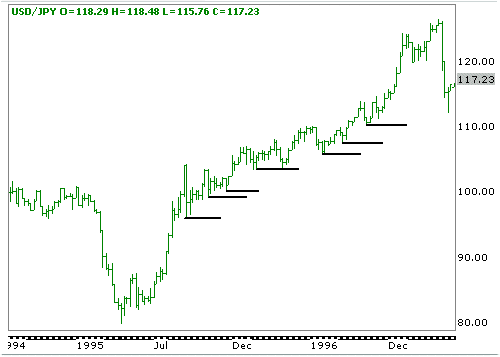
Well, is there any way to control the trades to make sure that we do not make those trades? Indeed. One of the best tips I can offer is to remember the definition of a trend. An uptrend is where both highs and lows are moving higher. Thus, until the most recent low s broken there is no break/reversal of the trend.
Let us look at how this would have worked:
MACD 3
As can be seen, I have drawn a horizontal line under each successive swing low. At no point is one of these broken until after the final high to the upper right of the chart. Thus, by combining information garnered from the price chart you can avoid many loss making trades.Good luck !
Read more ...

Sunday, 4 June 2006

My essential trading system

If you want to get to the top of the forex market �food chain� you have come to the right place. The strategy that we are about to reveal to you is a completely new, efficient and reliable trading strategy that comes as the result of years of forex market research using sophisticated mathematical methods and is based on a fundamental property of financial markets.

Regardless of how strong a long-term market trend is, the market never moves only in the direction of the long-term trend - there are always minor movements against the longterm market trend. These deviations usually don�t last very long and after them the market moves again in the direction of the long-term trend.
The picture above shows a snapshot of a E/U candlestick chart. Although the market shows both upward and downward market movements it can be easily recognized that the long-term market trend is clearly bearish.

Frequent relationships are 25%, 38%, 50%, 61% and 75% (Fibonacci ratios).
Suppose we entered the market short and the market move into our direction and reached the point (1).
However, after that the market starts an upward movement toward point (2). What to do now ? Inexperienced trader would like to close the position, happy to take small profit.

This would be the wrong decision because the market turned back to it's main direction afterwards....
Just an example but you will meet above situation frequently, the essential question is : When do we decide that our trade has run out of steam and should be exited ?

This is where our strategy come into play. We have used the phenomenon described above as a starting point to develope a complete original and until now the best trading system that combines basic principles of Elliot Wave theory together with well-know properties of Fibonaci rates. The result is amazing, as you will soon find out. It will help us find the best possible time to exit the trade and extract maximum profit from the market !
Tobe continued ...... Continue here
Author : Nicolebobbin
Read more ...