Showing posts with label forex signal indicator. Show all posts

Monday, 3 September 2012

Forex Simple Strategy


 Simple Strategy from " Bella " System
1. Open a 30 min chart EUR/USD. Insert RSI (14), Stochastic Oscillator (14,3,3) and
EMAS 5 and 13.
2. We have to watch for a divergence between the price and the RSI or the Stochastic.
This is very important, because sometimes we don�t see a divergence between the price
and the RSI, but the Stochastic show divergence compare to the price, and viceversa.
3. Once we saw the divergence we have to wait for the cross of the EMAS to go long or
short.
4. I prefer to open the position with 2 lots and close half the position with 20-30 pips of
profit, and move my sl to breakeven with the other lot, in case that the market begin to
trend, we can win more pips, and if the price begin to go against you, you keep the 20-30
of the other lot.
5. Always put sl of 20-25. This strategy presents like 10-12 oportunities in a month and it
is 90 % accurate.
6. Avoid to use this strategy when is big news day.
7. In the 15 min chart I had some bad signals and in the one hour chart we enter late to
the party of pips. This system can work for the GBP/USD too, but your stop have to be
like 30-40 pips.


Read more ...

Sunday, 26 August 2012

Forex Signal Indicator


How to Make Profit in 30 Minutes of "Work" with the Trend Sniping Strategy
  
The first trading set-up we are going to show you is the Dynamic SR setup.
As the name suggests the basis for this system is dynamic
support\resistance level which price has struggle to break. When price
touches this level we will wait for signs that price is reversing- and will
enter the trade.
In this system we will use the Moving Average level. Preferably the 20-
period Moving Average, though you can use any other period.
Step 1: Waiting for the MA to become sloped
We wait for the MA to become sloped (trending). This is a sign that the
trend is strong.
A sloped moving average means that the trend is strong and therefore
any retracement to the MA will probably lead to a continuation in price,
and a good trading signal for us to trade.
Step 2: Wait for price to touch MA
Wait for price to touch the MA, and reverse.
Reversal is confirmed when price goes above the high of the previous
candle (for long trades) or below the low of the previous candle (for
short trades).

Step 4: Placing Stop Loss
Stop Loss is placed:
� 5 pips below the lowest low of last 4 candles (for long trades)
� 5 pips above the highest high of last 4 candles (for short trades)
Exiting the Trade
Trade is closed when the moving average is no longer sloped = is flat.
Examples for trades


---- Steve Sollheiser --- edit by   sbudij  KarawangForex ------


Read more ...

Wednesday, 22 August 2012

Forex Signal Indicator

ANNOUNCEMENT
Effective from the date of 22 august 2012, the title of this blog changed to "Forex Signal Indicator", from the previous title "free forex signal - forex indicator"
Read more ...

Saturday, 17 September 2011

Trend Finder Indicator

Spikes Trend Finder

I want to share a new system that I've been using.
It's very simple, Still room for improvements. Or eventually,
to semi-automate it. And send an email alert to my phone,
When conditions are right.

Well lets get to it.

1. You use the Day, 4h, 1h, Charts
2. Always trade with the trend
3. Always set SL, And TSL.
(EURUSD,EURJPY,GBPUSD,AND GBPJPY = 100/100)
(All others = 50/50)

You start with 2 MA's, An 18 smoothed open, With a 14 smoothed closed
These are to verify over all trend

Next, You will have 3 sets of RSI's on the bottom.

First set : 2 RSI's , An 88 period open, And a 56 period closed, No set min or max

Second set : 2 RSI's , An 88 period closed, And a 56 period open, No set min or max

Third set
: 2 RSI's , An 2 period open, And a 2 period closed, set 0 min and 100
max With 20,80 lines, Or 10,90 lines, Your chose


In a downward trend,
You wait until price hits, or passes the first MA,
On the 1h chart,Before you ever look for a reversal.
Of coarse, The closer to the average you can get on
the day chart, the better.

First, Look at the MA's, And make sure they are
staying parallel, Or expanding

Next, You look for a cross, On all 3 RSI indicators at the bottom

Then I place my trade with SL, And TSL.
I don't use a TP, But a TSL instead.
I'm a big fan of set it, and forget it trading

You would just reverse this for an upward trend.

---- sbudij by Spike fx factory ------

Read more ...

Monday, 22 August 2011

Forex Trading Indicators

Read more ...

Sunday, 10 April 2011

Forex Trend Following Strategies

FX5 Forex Trading Strategy
FX5 forex trading strategy is a simple and effective trend following method for any major exchange rate. I hope you can adapt this strategy to suit your trading style.
Strategy Description: An intra day forex trend following trading method, using the
following technical indicators:
� 10 period WMA (Weighted Moving Average)
� 20 period SMA (Simple Moving Average)
� Slow Stochastic (10,6,6 (exponential))
� RSI (28)
� MACD (24/52/18 (exponential))

Forex Trading Rules:
1) Only take trades between 8AM-12PM EST and/or 2AM-4AM EST.
2) BUY the exchange rate when the 10 WMA crosses up past the 20 SMA and the Stochastic is signaling up (fast line above the slow line), RSI > 50 and the MACD histogram >0 and MACD averages crossed up.
3) SELL the exchange rate when the 10 WMA crosses down past the 20 SMA and the Stochastic is signaling down (fast line below slow line), RSI<50 and the MACD histogram <0 and MACD averages crossed down. 4) Try and take profits at or near key levels: Try and take profits at exchange rates ending with 00, 20, 50, 80 e.g. EUR/USD 1.1980 5) Stop-Loss Level: discretionary or below/above most recent level of support and resistance.

----- by Erol Bortucene -------
Read more ...

Thursday, 3 March 2011

YoutradeFX - Futures Broker

YouTradeFX is an internet brokerage and investment firm. Through the company�s website and trading platform, traders can invest in CFD�s (certificates for difference) on stock, commodities, indices and the foreign exchange market
YoutradeFX caters to a growing client base of private and institutional traders, 24 hours a day, 6 days a week, providing specialized trading services in over 10 languages
YouTradeFX has developed automated trading tools (expert advisors, custom indicators and scripts) that require minimal intervention and allow traders to automate their trading strategy, improve discipline, remove emotion, and capture opportunities. Traders can choose from over 20 predefined trading strategies to create custom portfolios and automatically execute trades according to their specifications.
Spreads: Competitive and low spreads from just 1 pip, fixed 24 hours a day.
Leverage: Greater buying power with leverage up to 1:400.
Fees: Commission free for all trading instruments.
Margin: There are no margin requirements for accounts under $100,000. We feature guaranteed Stop-Loss meaning that traders cannot loose more than their original investment.
Mini Trading: Traders may deposit as little as $100, and to open a position with as little as small as $10,000 or 0.1 Lots.
Account Classes: Traders can choose between four different account types: Mini for under $5,000, Standard $5000 -$25,000, Classic $25,000 - $100,000 and Premium Account for $100,000 and over.
49 Tradable Instruments: These include 36 currency pairs, Gold, Silver, Oil, CFDs on the world�s biggest indices including NASDAQ, Dow Jones, FTSE, CAC and so on. We also feature 17 stocks such as Google, GE, Microsoft, IBM, Wal-Mart and Apple .

Regulation and Compliance
As a financial investment company, YouTradeFX has a Category 1 Global Business License issued by the Financial Services Commission (FSC) of the Republic of Mauritius under the name of International Youtrade Investments MA Ltd. Company No.: 097392 C1/GBL; Category 1 Global Business, License ? C110008678.

International Youtrade Investments MA Ltd. 4th Fl. Unicorn Centre
18N Fr�re Felix de Valois St. Port Louis, Mauritius

You Trade Holdings Limited Offices
London Branch
12 The Shrubberies, George Lane, London
Germany Branch
Marienstra�e 19/20, 10117 Berlin-Mitte, Germany
Turkey Branch
Buyukdere Ave Meydan Str. Spring Giz Plaza 17, Sisli/Maslak Istanbul, Turkey
India Branch
A-41, Naraina Industrial Area, Phase II, 110028 New Delhi, India

=== YTFX Affiliate - The Best Forex Affiliate Program =====

YTFX Affiliate - The Best Forex Affiliate Program
1# converting forex broker.
Transparency with our Forex Affiliates.
Top offers including $250 CPA plus bonuses.
The best of the line marketing and statistic tools.
� 50% bonus for clients on first deposit
� 1 pip spread on major currencies
� Free expert advisors
� Professionally Managed account
� Free MT4 hosting
For more information regarding YTFX forex affiliate programs�Click Here�

---- YTFX === by ; sbudij -----
Read more ...

Thursday, 13 January 2011

ZULUTRADE News Update

I . ZULUTRADE Signal Provider Performance
� There was a time when trading was a headache. Not anymore! You don't have to study or monitor the market to make a good pick, because hundreds of signal providers from all over the world are doing it for you. All you have to do is pick the experts you like, and ZuluTrade will quickly convert their advice into live trades in your trading account directly with the broker. And the best of all, it's completely FREE !!! - see ZuluTrade Review

see..MARCH 2011...update�ZULUTRADE Signal Providers Performance... Click here

II . ZuluTrade just released a new version of website content with somecool New Features

1 . New ZuluTrade Desktop Widget!
ZuluTrade release the ZuluTrade Desktop Widget! View your account details in real-time without the need to be logged in to zulutrade.com!
What can you do with this Widget?
-View your account equity and profit/loss
-View your account PnL, open positions
-View your selected Signal Provider's performance charts
-Switch between your accounts

Mouse over the ZuluTrade widget for controls. Use left/right button for previous/next provider. Up/Down button changes between screens.
Visit www.zulutrade.com/?widget to download

2 . Provider Alerts: ZuluTrade created an automated system that detects changes in a Signal Provider's trading strategy. A warning message will be displayed in the Provider's profile page when:
Higher slippage than pips per trade is detected
Draw Down is more than 100% on Provider accounts with more than 1000 pips profit

3 . Fully Customizable Demos! By popular demand, Demos are now fully customizable. Customize your Demo account options: balance, currency and leverage

4 . Provider Notifications: ZuluTrade will send notifications to your email to inform you of certain events:
When a Signal Provider you follow has increasingly worse trades than his/her previous worst trade.
When a Signal Provider that you follow has stopped trading his live account in ZuluTrade.
When a Signal Provider that you follow has a significant change in his/her average trade time.
You can select which notifications will be sent to you from the Profile tab in your account.

6 .NEW iphone app version
Retina display support User Interface Improvements

7 .NEW economic calendar available
View upcoming/past economic events

Click Here�For a free ZuluTrade Demo account OR For a Live Broker account:

Visit ZULUTRADE detail Information Click� USER GUIDE or FAQ

Thank you for your interest and we look forward to having you join our family of Zulu traders


--- sbudij - Karawang Forex--------

Read more ...

Monday, 15 November 2010

The Donchian Bands Indicators

Forex Indicator The Donchian Bands
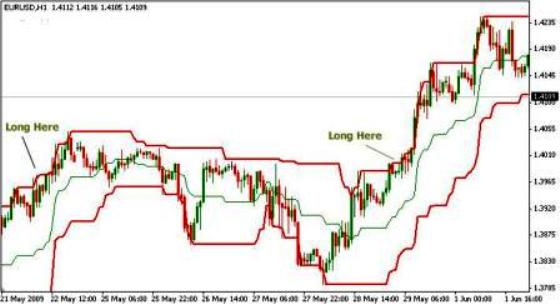
The Donchian Bands (or Channel), named after Richard Donchian, are bands of High and Low of price. They are very useful for projecting support and resistance levels of price and define boundaries for price action.

The Donchian Bands are calculated in a simple formulas:
Upper Band = Highest High of X periods
Lower Band = Lowest Low of X periods
X is the calculation period of the Donchian Bands.

How It Is Used
The Donchian Bands are mainly used as a breakout indicator - they define support and resistance and generate entries as price breaks these levels. Because Lows and Highs usually correlate with Support and Resistance level, this indicator is useful in objectively defining Support and Resistance levels.
However, it can also be used as a reversal signal - entering when price touches a band and reverses its direction. Before using the indicator in this fashion, confirm the validity of the psychological level by demanding at least 2 touches at the level. This ensures that the signal is strong and enhances its reliability.
Another way of trading the Donchian Band is using its Middle Band. The middle band is the average of Upper and Lower band, and can also be used to gauge trend. Entry signals are generated in the following way: When price crosses the middle band from below - buy, and when price crosses from above - sell. It can be a powerful signal when trend strength is confirmed (with Support and Resistance or indicators).


Trading with Donchian Bands
As described, there are several ways of interpreting and trading the Donchian Bands. The most commonly used is the breakout:
Long Trades - Long trades are entered when price breaks above the 20-period Upper Donchian Band. Conservative traders wait for price to close above the Donchian Upper Band to enter.
Short Trades - Short trades are entered when price breaks below the 20-period Lower Donchian Band. Conservative traders wait for price to close below the Donchian Lower Band to enter.


Download Donchian Bands for MetaTrader 4 CLICK Here...


.....Others Indicators...Click Here....


Read more ...

Sunday, 8 August 2010

Forex Trading Strategy - Double Doji

The Secret of the Double Doji
Today we've got you a complimentary PDF describing one
of the simplest but most profitable strategies you can ever
use in your FX trading...

Secret Of The Double Doji�.
Click here - Free Download PDF

The strategy was created by Vladimir Ribakov, one of the
finest traders around. Vladimir is one of a VERY few people
who actually trades for a living.

The "Doji" pattern is one of the most incredible patterns among the
Japanese candlesticks. For some reason it is not referred to very often.
Maybe that explains why it is extensively used by pros�
The Doji hints us that the market is in a state of balance of powers: the buyers' strength has run our, but so is the sellers'. So this is a state of temporary calmness, just before a major move.

The shape of the candle can tell us all. Every candle tells its part of the complete story. We just need to learn how to put together this puzzle.

I found it to work best on the 1-hour, 4-hours and daily charts.
The best currency pairs are the ones that involve the USD, and also all
the Yen crosses (EUR/JPY, GBP/JPY, AUD/JPY etc.)

I'm proud to have the opportunity to present to you such a successful
strategy, and to help you reach your financial goals.

...sbudij....by; Vladimir Ribakov

Read more ...

Monday, 22 February 2010

The FxOverEasy System

This system work off 15 Min Charts. We are looking for 3 Things�3 reasons to entri the market.

1. DIRECTION


SHI Channell which automatically recalculated in real time gives us the direction we are going to trade. If slope is down we are only looking to sell. If Slope is up we are looking to buy.

IF THE THE CHANNEL IS THIN ( NARROW ) WE DON�T TRADE

If Price falls outside the channel�we don�t trade ( unless in trade already ) we wait for a new channel to form

2. ENTRY / EXIT


Remembering we only trade in the given direction of the slope of the SHI Channel

The Second is LaGuerre. When LaGuerre line cross down through .75 line ( top line ) look to SELL�..When the line crosses up thru .15 line ( bottom line ) look to BUY� if JUICE is still Green leave trade to opposite side of channel if it is Red then Exit trade when LaGuerre Reaches its Mid line (.45).

Perkyasctrend1 is for the weary and the last indicator to normally show Pink Dot Sell � Blue Dot Buy. This Indicator not Necessary for advance traders

Safety Stop�normally are 15 pips

3. VOLATILITY


This last but not least Indicator is called JUICE�. Never enter a Trade when Histogram is Red if all Indicators line up this is the last check and the Histogram shoul be Green


REMEMBERING.!!! We only Trade in the Direction of the Slope of the SHI Channel 
Read more ...

Thursday, 11 February 2010

� Surefire � Mechanical Trading System

Hi, this is Jeff Miller from Forex Cash Evolution team.
I am about to give you a simple but powerful mechanical system �Surefire Forex Trading System�.

This mechanical system is a DAILY system.
This is how it works: You can open the chart (for any pair, you might trade as many pairs at the same time as you want). Then, you spot the signals, enter the orders, then close the charts, shut down the computer, and go to sleep. Next day, you open the charts again, check your existing orders to see how much you have made.

Let dive into it. I will make it very simple and short.

1. Download Surefire Trading System template file Click here�
2. Open a daily chart (you can trade on any pair, but major pairs are recommended)
3. Make your trades. Here is how, let me explain:
The template file is basically to set up two following indicators candlestick chart:
- RSI (8) (white color)
- EMA (8) (cyan color)

You don�t need to know what are these two indicators. Please behind them. Here is what you need to know:
1. Enter a short order when: The RSI crosses its moving
2. Enter a long order when: The RSI crosses its moving
3. Stop Loss: You should only risk 1% of your account per the high of the previous DAILY bar if you are buying, previous bar if you are selling.
4. Take Profit: Any, 30-50 pips are recommended.

Below are some examples of Selling / Buying


Selling Order
The RSI crosses its moving average from above.
BUYING order
The RSI crosses its moving average from below

Happy Trading..

Jeff Miller / Forex Cash Evolution 
Read more ...

Monday, 1 February 2010

ZuluTrade - The All New Peer To Peer Autotrading Service

ZuluTrade was founded in 2006 by Leon Yohai. ZuluTrade bridged the gap between valuable information in money markets and trade execution by converting the advice of some of the most professional and talented traders globally, to a rapidly executed trade.

There was a number of challenges. The existing autotrading technology could not allow to trade multiple accounts at the same time, since scaling problems could occur at the broker's side. We had to sit down with the brokers and redesign the APIs (in some cases we have developed APIs of our own) in order to accommodate all the demand in large scale We had to develop from scratch the API for the so famous MT4 platform, since Metaquotes does not provide any API. In addition, other brokers offered non functional APIs that had to be redeveloped in order to be able to accommodate multiple accounts at the same time. The concept of Zulutrade is to offer an open environment, where traders globally could connect any trading platform and share their knowledge, plus a rebate every time someone uses their knowledge as a live trade.

Now..ZuluTrade has become one of the major autotrade destinations worldwide.
� Over 30,000 accounts.
� Over 19 billion trading volume for 2009.
� Over 1,200 traders to autotrade.
� No need to have your PC on.
Every day, ZuluTrade receives thousands of buy and sell recommendations from some of the most popular signal providers in the market today - ZuluTrade will quickly convert their advice into live trades in your trading account directly with the broker. And the best of all, it's completely FREE!

Any individual can become a ZuluTrade signal provider. It is not possible on ZuluTrade to misrepresent the performance of the signals generated. If ZuluTrade shows a profit or loss, it is accurate, because details are confirmed by the dealing broker�s statements. For each pip stated in the performance section, there is a trade registered in the broker�s backoffice. The results are a combination of hypothetical and actual results.
A signal provider places trades on his or her account, and all clients that have selected this provider in their account settings page receive these trades on their accounts, unless they do not have enough usable margin, or have their max open lots set to low. Signal providers provide signals for all clients who select them in their accounts settings page.
Signal providers get 0.5 pips for each traded lot of his or her own signals ONLY. So provider signs up, sends signals, and passively waits for clients to use their signals, trying to have good performance to attract them.

Partner with ZuluTrade is an excellent way of building an income through an affiliate relationship. You benefit from promoting a strong brand with a useful product which translates into high conversions. ZuluTrade represents an outstanding opportunity for affiliates to build an ongoing income. Affiliates choose a designated URL (web page) to advertise ZuluTrade and draw clients to use our revolutionary service
ZuluTrade affiliates can earn from $100 up to $1 million per month depending on the number of clients.

Anyone can be a ZuluTrade Affiliate
instantly by filling out the form Click Here... Once you become an Affiliate , you will be given a url of the type yourname.ZuluTrade.com that you can then advertise and bring clients to ZuluTrade. For each lot that your clients trade on ZuluTrade, you will get paid 0.4 pips, which is equivalent to about$3-4 per lot for standard accounts.
ZuluTrade is Most famous FX affiliate program : 10,000 affiliates, Industry founders, Worldwide recognition. NFA regulated, Access to 20 FX brokers ( such ie; FXCM, FxOpen,DukasCopy, FXDD, Alpari, AVAFX, ODL,CMS,ACM,FOREX.COM, Prime4X, FxSolution, and many more�see here..
Highest conversion rate from demo to live!
� 7% conversion from demo to live
� 600% higher than the current industry rate

Join ZuluTrade as a Signal Provider CLICK Here�.
Open Real account�
Choose between the best real Brokers worldwide and create a new LIVE auto-trading ZuluTrade account, whether you have or not an account with that broker!

Get Demo account�
Get a free DEMO ZuluTrade account with virtual funds and the same functionality as a Live ZuluTrade account.

To become an a affiliate go to our homepage and the top of the page select �affiliates� and fill in the requested information �OR CLICK Here�.

Visit ZuluTrade Details Information FAQ ..Click Here�.

See..ZuluTrade Performance Click Here�


ZULUTRADE INC - NFA, CFTC Member ID 0389149

----- by; KarawangForex ------ 
Read more ...

Bollinger Bands Indicator Measure The trend Forex

Bollinger bands include the development of courses within an envelope used to both support and resistance, an indicator of trend and volatility.
The standard deviation Bollinger bands is calculated based on market volatility. More courses vary, faster bands differ.

According to John Bollinger, the only use of this system does not generate strong position and should be used with other technical indicators.

Defaults

- A simple moving average 20 days

- High Band = moving average 20 days + 2 standard deviations to 20 days of average

- Low Band = moving average 20 days - 2 standard deviations to 20 days of average
Use of Bollinger Bands

- Identify a change in trend

The price changes tend to occur after a narrowing of the bands.


Bollinger Bands

- Measure the Force of a trend

The greater the gap between the lower band and upper band, the greater the tendency is strong. Lessons emerging bands give a strong signal of continued trend.


Bollinger Bands

- Playing round trips between bands

Tapes can be used as support and resistance. After touching a band, classes tend to want to go touch the opposite band. This technique may be useful in a market without trend and when the bands are parallel.
 
Read more ...

Saturday, 16 January 2010

Schaff Trend Cycle Indicator

Schaff Trend: A Faster And More Accurate Indicator
The Schaff Trend Cycle Indicator is the product of combining Slow Stochastics and the Moving Average Convergence/Divergence (MACD). The MACD has a reputation to be a trend indicator, yet it has an equal reputation to be lagging due to its slow responsive signal line. The improved signal line gives the STC its relevance as an early warning sign to detect currency trends.

How the STC Works

The STC detects up and down trends long before the MACD. It does this by using the same exponential moving averages (EMAs), but adds a cycle component to factor currency cycle trends. Since currency cycle trends move based on a certain amount of days, this is factored into the equation of the STC Indicator to give more accuracy and reliability than the MACD.

Since the MACD is nothing more than a series of EMAs with a signal line, the STC has improved on the MACD. MACD has a 12- and 26-period EMA with a nine-period signal line. STC Indicator improved on this by incorporating a 23- and 50-period EMA with a cycle component used as the 10-period signal line. Since we can factor cycle trends based on X amount of days, we can then know how far and how long a trend lasts in terms of potential pips to earn.

In terms of indicators both old and new, the STC Indicator is quite original in its conception. Never before has an indicator been developed using a cycle component. Most use some form of moving average, particularly EMAs, as a base because it's easier to calculate and it focuses on recent prices rather than a simple moving average's long data set of closing prices. (Learn more about stochastics )

STC Development

The STC Indicator was developed primarily for fast markets, particularly currency markets, yet it can be employed in any market.The trend in the modern day is to develop more accurate, reliable and early warning signal detectors to follow prices more accurately using the old models. The invention of the computer made it able to capture speed, accuracy and reliability of prices more uniformly, because the computer eliminated the need to calculate long equations using pen and paper. So, any new modern indicator will always have a higher reliability factor when a signal is generated.

However, as reliable as the STC Indicator may be, never will an indicator be perfect. The reliability factor may be higher but slight problems exist because of the STC's ability to stay in overbought and oversold markets for extended periods. For this reason, the STC Indicator should be used for its intended purpose: to follow the signal line up and down and take profits when the signal line hits bottom or top. Eventually another signal will generate.

An Example

The technical code for the STC works like this. Inputs: TCLen (10), MA 1 (23), MA 2 (50). Plot 1 (_SchaffTC(TCLen.MA1, MA2), Schaff_TLC. Plot 2 (25). Plot 3 (75).


Source: Standard Pro Charts
Take a look at the hourly chart of the GBP/JPY, the granddaddy of currency pairs. The MACD generates its signal when the MACD line crosses with the signal line. The STC Indicator generates its buy signal when the signal line turns up from 25 to indicate a long or turns down from 75 to indicate a short. Notice how many more signals the STC generated compared to MACD. It served as an early warning of trend change on the far left with the long red candle. A sell signal was generated at 142.50 and stopped at 139.50, a 300 pip move. While the MACD lines hovered around 140, the STC line generated a buy signal at about 140.00 and stopped at 142.45, a 245 pip move. The next sell signal was generated at about 144.00 and lasted until 141.50, a 250 pip move. These moves occurred ahead of the buy and sell signals generated by MACD.

Indicator Issues
Notice how many times the STC line resulted in a straight line to signal an overbought or oversold market. One certain aspect is that oversold markets will eventually become overbought and overbought markets will become oversold, especially when it comes to the currency cycle aspects of this indicator. Yet that is not a signal generator. Overbought or oversold markets represented by a straight line can in many instances still represent 200 points on the upside, as it did at the overbought mark at 14:00 in the middle of the chart. This is the small problem with the STC Indicator. The recommendation is to wait for the signal before jumping in.

One can increase the cycle count signal line from 10 and adjust upwards to fit the exact market. This would represent smaller market turns and a more accurate reading. Caution is advised not to increase the cycle count higher than 40, since that is the maximum currency count. One can also adjust downward to generate many market turns, but they may not be accurate signals. For longer time framed charts such as the weekly, it is recommended to adjust the EMAs to 12 and 26 or 7 and 13, and allow the same amount of cycle counts at 20 as the signal line. For shorter time frames, such as the 10-minute chart, increase the EMAs to 115 and 240, and allow the same cycle count. A personal recommendation is to allow the indicator to work as intended with the recommended settings, especially when it comes to cycle counts. Better to adjust the EMAs rather than the cycle count trigger line if one has to adjust at all.

Conclusion

The inventor of the STC Indicator allowed the full knowledge of formulas and codes to be released in 2008, so the trading public is now becoming aware of its use as an early warning trend signal. I have personally used and profited from its use on many occasions, and I have personally used the recommended settings. The interesting aspect is that this indicator is forward-looking, and is considered a leading indicator. This means false signals are very rare if ever generated. Plus, signals are generated much faster than the old indicators, such as MACD. For another recommended indicator that works as intended, this is a good one.

---- by Brian Twomey ------


Read more ...