Showing posts with label Forex Trading Indicator. Show all posts

Friday, 1 June 2012

Simple Forex Strategy


Dear Traders. I found another very simple but very powerful system in my
Free Forex Systems library. It�s a free system and available for free on some
free Forex websites in different variations. I like it and I thought you may be
interested to try it.
Description:
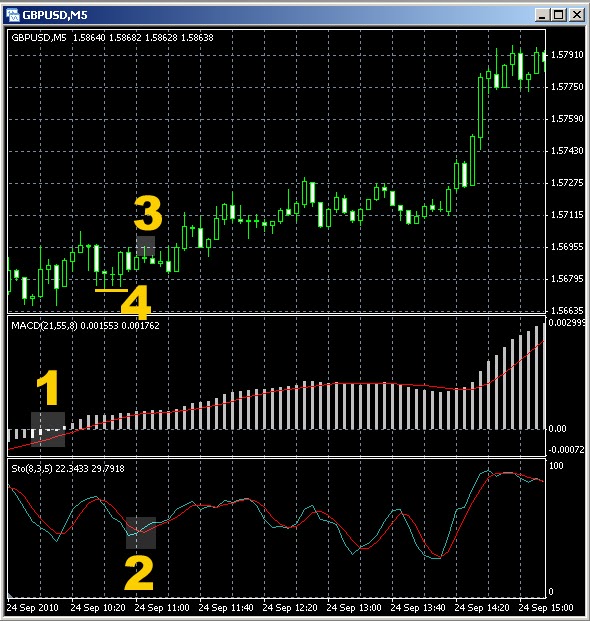
Simple Strategy. Using Slow MACD Indicator & Fast Stochastic.
This strategy is very simple and successful but will not get you in at the
beginning of the move or exit at the end but will give a high success rate.
Setup:
Timeframe: Any
Currency:Any
MACD: 21 55 8
Stochastic: 8 3 5
How it works:
When the MACD Line and Signal Line cross, wait for the Stochastic to cross in
the same direction!! (Don`t trade if Stochastic in overbought/oversold
zones)If you are an agressive trader you can enter when the MACD and
Stochastic cross at the same time, otherwise once the MACD has crossed, wait
for the Stochastic to cross before entering. (The MACD must cross first)
Exit the trade when the MACD lines cross back.


 1 � MACD signal line cross 2 - Stoch crossed in the SAME direction 3 �
ENTRY POINT ( long in this case) 4 � Recommended Stop loss 3 pips below
the nearest (in this case) support level
Stop loss: Place a stop loss Recommended Stop loss 3 pips below for LONG
entries or 3 pips above for SHORT entries the nearest support (for LONG) or
resistance (for SHORT) levels


 source  fr Karl Dtm     by : sbudij

Read more ...

Thursday, 17 May 2012

Forex TRAPPING Strategy


This method is basically to do with what a pair moved like the previous 24 hour period.
In this, I will use the GBPJPY, but one could use it on any pair.

Method/Strategy:
You choose your own 24 hour period move - here as an example I will be using 21:00 to 21:00 GMT+1 (my local time).
Mark the High, Low and Close for selected 24 hours.

For example, the GBPJPY for the last 24 hours was: H 138.67 L136.00 and C 138.13
Now total movement was (high-low) 267 pips.

You set your Buy and Sell orders 25% of the 267 total move away from the Close price. Therefore, 25% of 267 pips is 67 pips, thus your orders would be:
BUY at 138.80 (Close + 67 pips)
SELL at 137.46 (Close - 67 pips)
Set your TP also only to 25% of the previous days move - in this case also 67 pips. In theory, if the chosen pair then move only 50% of the previous days total move, you profit ...
Set your SL levels 10 pips away from the opposite order.

Depending on what time zone you are in, I would suggest setting your orders before "your" market opens ... in my case it would be the London Market at 08:00 GMT.


source fr other fx blog's


Read more ...

Saturday, 17 September 2011

Trend Finder Indicator

Spikes Trend Finder

I want to share a new system that I've been using.
It's very simple, Still room for improvements. Or eventually,
to semi-automate it. And send an email alert to my phone,
When conditions are right.

Well lets get to it.

1. You use the Day, 4h, 1h, Charts
2. Always trade with the trend
3. Always set SL, And TSL.
(EURUSD,EURJPY,GBPUSD,AND GBPJPY = 100/100)
(All others = 50/50)

You start with 2 MA's, An 18 smoothed open, With a 14 smoothed closed
These are to verify over all trend

Next, You will have 3 sets of RSI's on the bottom.

First set : 2 RSI's , An 88 period open, And a 56 period closed, No set min or max

Second set : 2 RSI's , An 88 period closed, And a 56 period open, No set min or max

Third set
: 2 RSI's , An 2 period open, And a 2 period closed, set 0 min and 100
max With 20,80 lines, Or 10,90 lines, Your chose


In a downward trend,
You wait until price hits, or passes the first MA,
On the 1h chart,Before you ever look for a reversal.
Of coarse, The closer to the average you can get on
the day chart, the better.

First, Look at the MA's, And make sure they are
staying parallel, Or expanding

Next, You look for a cross, On all 3 RSI indicators at the bottom

Then I place my trade with SL, And TSL.
I don't use a TP, But a TSL instead.
I'm a big fan of set it, and forget it trading

You would just reverse this for an upward trend.

---- sbudij by Spike fx factory ------

Read more ...

Monday, 22 August 2011

Forex Trading Indicators

Read more ...

Sunday, 10 April 2011

Forex Trend Following Strategies

FX5 Forex Trading Strategy
FX5 forex trading strategy is a simple and effective trend following method for any major exchange rate. I hope you can adapt this strategy to suit your trading style.
Strategy Description: An intra day forex trend following trading method, using the
following technical indicators:
� 10 period WMA (Weighted Moving Average)
� 20 period SMA (Simple Moving Average)
� Slow Stochastic (10,6,6 (exponential))
� RSI (28)
� MACD (24/52/18 (exponential))

Forex Trading Rules:
1) Only take trades between 8AM-12PM EST and/or 2AM-4AM EST.
2) BUY the exchange rate when the 10 WMA crosses up past the 20 SMA and the Stochastic is signaling up (fast line above the slow line), RSI > 50 and the MACD histogram >0 and MACD averages crossed up.
3) SELL the exchange rate when the 10 WMA crosses down past the 20 SMA and the Stochastic is signaling down (fast line below slow line), RSI<50 and the MACD histogram <0 and MACD averages crossed down. 4) Try and take profits at or near key levels: Try and take profits at exchange rates ending with 00, 20, 50, 80 e.g. EUR/USD 1.1980 5) Stop-Loss Level: discretionary or below/above most recent level of support and resistance.

----- by Erol Bortucene -------
Read more ...

Thursday, 3 March 2011

YoutradeFX - Futures Broker

YouTradeFX is an internet brokerage and investment firm. Through the company�s website and trading platform, traders can invest in CFD�s (certificates for difference) on stock, commodities, indices and the foreign exchange market
YoutradeFX caters to a growing client base of private and institutional traders, 24 hours a day, 6 days a week, providing specialized trading services in over 10 languages
YouTradeFX has developed automated trading tools (expert advisors, custom indicators and scripts) that require minimal intervention and allow traders to automate their trading strategy, improve discipline, remove emotion, and capture opportunities. Traders can choose from over 20 predefined trading strategies to create custom portfolios and automatically execute trades according to their specifications.
Spreads: Competitive and low spreads from just 1 pip, fixed 24 hours a day.
Leverage: Greater buying power with leverage up to 1:400.
Fees: Commission free for all trading instruments.
Margin: There are no margin requirements for accounts under $100,000. We feature guaranteed Stop-Loss meaning that traders cannot loose more than their original investment.
Mini Trading: Traders may deposit as little as $100, and to open a position with as little as small as $10,000 or 0.1 Lots.
Account Classes: Traders can choose between four different account types: Mini for under $5,000, Standard $5000 -$25,000, Classic $25,000 - $100,000 and Premium Account for $100,000 and over.
49 Tradable Instruments: These include 36 currency pairs, Gold, Silver, Oil, CFDs on the world�s biggest indices including NASDAQ, Dow Jones, FTSE, CAC and so on. We also feature 17 stocks such as Google, GE, Microsoft, IBM, Wal-Mart and Apple .

Regulation and Compliance
As a financial investment company, YouTradeFX has a Category 1 Global Business License issued by the Financial Services Commission (FSC) of the Republic of Mauritius under the name of International Youtrade Investments MA Ltd. Company No.: 097392 C1/GBL; Category 1 Global Business, License ? C110008678.

International Youtrade Investments MA Ltd. 4th Fl. Unicorn Centre
18N Fr�re Felix de Valois St. Port Louis, Mauritius

You Trade Holdings Limited Offices
London Branch
12 The Shrubberies, George Lane, London
Germany Branch
Marienstra�e 19/20, 10117 Berlin-Mitte, Germany
Turkey Branch
Buyukdere Ave Meydan Str. Spring Giz Plaza 17, Sisli/Maslak Istanbul, Turkey
India Branch
A-41, Naraina Industrial Area, Phase II, 110028 New Delhi, India

=== YTFX Affiliate - The Best Forex Affiliate Program =====

YTFX Affiliate - The Best Forex Affiliate Program
1# converting forex broker.
Transparency with our Forex Affiliates.
Top offers including $250 CPA plus bonuses.
The best of the line marketing and statistic tools.
� 50% bonus for clients on first deposit
� 1 pip spread on major currencies
� Free expert advisors
� Professionally Managed account
� Free MT4 hosting
For more information regarding YTFX forex affiliate programs�Click Here�

---- YTFX === by ; sbudij -----
Read more ...

Thursday, 13 January 2011

ZULUTRADE News Update

I . ZULUTRADE Signal Provider Performance
� There was a time when trading was a headache. Not anymore! You don't have to study or monitor the market to make a good pick, because hundreds of signal providers from all over the world are doing it for you. All you have to do is pick the experts you like, and ZuluTrade will quickly convert their advice into live trades in your trading account directly with the broker. And the best of all, it's completely FREE !!! - see ZuluTrade Review

see..MARCH 2011...update�ZULUTRADE Signal Providers Performance... Click here

II . ZuluTrade just released a new version of website content with somecool New Features

1 . New ZuluTrade Desktop Widget!
ZuluTrade release the ZuluTrade Desktop Widget! View your account details in real-time without the need to be logged in to zulutrade.com!
What can you do with this Widget?
-View your account equity and profit/loss
-View your account PnL, open positions
-View your selected Signal Provider's performance charts
-Switch between your accounts

Mouse over the ZuluTrade widget for controls. Use left/right button for previous/next provider. Up/Down button changes between screens.
Visit www.zulutrade.com/?widget to download

2 . Provider Alerts: ZuluTrade created an automated system that detects changes in a Signal Provider's trading strategy. A warning message will be displayed in the Provider's profile page when:
Higher slippage than pips per trade is detected
Draw Down is more than 100% on Provider accounts with more than 1000 pips profit

3 . Fully Customizable Demos! By popular demand, Demos are now fully customizable. Customize your Demo account options: balance, currency and leverage

4 . Provider Notifications: ZuluTrade will send notifications to your email to inform you of certain events:
When a Signal Provider you follow has increasingly worse trades than his/her previous worst trade.
When a Signal Provider that you follow has stopped trading his live account in ZuluTrade.
When a Signal Provider that you follow has a significant change in his/her average trade time.
You can select which notifications will be sent to you from the Profile tab in your account.

6 .NEW iphone app version
Retina display support User Interface Improvements

7 .NEW economic calendar available
View upcoming/past economic events

Click Here�For a free ZuluTrade Demo account OR For a Live Broker account:

Visit ZULUTRADE detail Information Click� USER GUIDE or FAQ

Thank you for your interest and we look forward to having you join our family of Zulu traders


--- sbudij - Karawang Forex--------

Read more ...

Sunday, 3 January 2010

�Brain Trading� Profitable Trading System

Now I wish to comment about BrainTrading software indicator, a system best indicator which is till now, But many people who is having this indicator obtains it is incomplete or result of copy from assorted of source. Braintrading system very effective indicator if applied in correctness, myself had applied this system since last three years ago and proven effective and profitable. pleased download BrainTrading Trade manual to can be applied correctly/effective

How To Use BrainTrading System
BrainTrading System indicator package includes four main independently calculated indicators: BrainTrend1, BrainTrend1Stop, BrainTrend2, BrainTrend2Stop and four auxiliary indicators used for pictorial presentation of main indicators: BrainTrend1Sig, BrainTrend1StopLine, BrainTrend2Sig, BrainTrend2StopLine.

IMPORTANT! (BrainTrend1, BrainTrend1Sig, BrainTrend1Stop, BrainTrend1StopLine), (BrainTrend2, BrainTrend2Sig, BrainTrend2Stop, BrainTrend2StopLine), (BrainTrend1, BrainTrend1Sig, BrainTrend1Stop, BrainTrend1StopLine, BrainTrend2Sig, BrainTrend2Stop, BrainTrend2StopLine) are priority groups of indicators of the BrainTrading System

BrainTrend1 and BrainTrend2 are market �DIRECTION� indicator. It shows trend direction by colors, when the market changes to or stays in an up-trend, the bars become or remain BLUE. When the market changes to or stays in a downtrend, the bars become or remain RED. When the market goes sideways or is not strong on either side, the bars become or remain GREEN. BrainTrend1 and BrainTrend2 indicators can work with any time bar charts.

IMPORTANT! Don�t use BrainTrend1 and BrainTrend2 indicators on one chart at the same time. You need to use BrainTrend1 indicator as main on all charts and use BrainTrend2 as confirmative indicator in separate chart window.

BrainTrading system indicator Chart


Free Download BraimTrading system - Trade Manual CLICK Here...


Others Forex ebook - Free Download CLICK Here...
Read more ...

Friday, 16 October 2009

Forex Trading Strategy

3 Simple Breakout Strategies You Can Use When Trading Forex
This article describes three different ways you can trade forex breakouts.
Trading breakouts is one of the most popular methods of trading the forex markets because you often get large moves after a period of consolidation. So with that in mind, I've listed below three basic strategies you can use to trade these breakouts.

The first of which is based on technical analysis, and in particular the Bollinger Bands indicator. Bollinger Bands are envelopes based on a moving average and a standard deviation and are most useful in showing areas of support and resistance through the two outer lines of the envelope.

Therefore when the price breaks out of either the upper or lower limit, this very often is a strong indication that a breakout is about to take place in the same direction. It's particularly the case after a period of consolidation where the bandwidth of the Bollinger Bands has narrowed out. For greater success you can use the breaching of one of the outer lines to gain your attention, and then wait for a pullback to either the EMA (5) or EMA (20), for example, for a good entry point.

The second method you can use to trade breakouts is also based on technical analysis and involves various Exponential Moving Averages, or EMA's for short. This is a method I have developed over the years that makes use of the 5, 20 and 50 period EMA's (you can also use the 100 or 200 period EMA as well).

What you do is wait until the price, along with the 5, 20 and 50 period EMA's have all flattened out and are all very close to each other. Then you simply wait for a strong breakout from this narrow range and take a position close to the EMA (5) when the breakout takes place. This can be very rewarding when you catch a good breakout, particular when you use longer time frames.

The final method is based entirely on price and uses no technical indicators at all. It's based on the fact that the price does not stay in the same range forever and will at some point break out of the current trading range.

I have to admit I don't use this method myself but there are various ways you can trade this way. Some traders like to use the previous day's upper and lower price range, and trade any breakouts of this range the following day. Similarly some traders wait until a very narrow price range has formed and then wait for a breakout to occur.

So overall there are various different ways you can trade breakouts, all of which have their merits. Despite being quite basic methods, they can be extremely lucrative because the price often moves strongly in one direction or the other after a sustained period of consolidation
Read more ...

Saturday, 26 September 2009

Forex Trading System

Profit With Forex Opening Range Breakouts
Many forex traders like to incorporate forex breakouts into their overall trading strategy because they can be extremely profitable. When a price finally breaks out of a tight trading range, many traders tend to jump on board and carry the price further away from this trading range, which is why this strategy is so effective.

Focus on Opening Range Breakouts

One of the most popular ways of trading these breakouts is by focusing specifically on overnight / opening range breakouts. By that I mean the opening hours of the new trading day. I myself tend to focus on the hours between 00.00 and 06.00 GMT and predominantly concentrate on the British and European-based pairs such as the GBP/USD and EUR/USD pairs, for instance.

These hours are notoriously quiet and yet these few hours before the busy opening session set the tone for the rest of the day. You will often find that the price will stay confined in a fairly tight range during these six hours or so and when the UK and European markets open, the price will trend significantly in one direction and will often break strongly out of this initial trading range.

Therefore a profitable strategy is to open a long position when the high point of this opening range is breached and open a short position when the low point is breached. There are various ways you can put this system into practice. You can either open a position as soon as the price crosses the line or as soon as the breakout candle closes, or you can wait for a pull-back and then jump on board if the price continues to move in the direction of the initial breakout.

All of these methods tend to work quite well and there is a logical reason why this is the case. The fact is that every currency pair has an average daily range, i.e the average number of points between the high and low points for a given trading day. So on those days where the opening range is very narrow, this initial range will be a mere fraction of the overall average, so therefore you can expect some big price moves to occur during the rest of the day either above or below the overnight range.


Read more ...

Forex Trading Indicator

Read more ...

Wednesday, 2 September 2009

Forex Strategy ; Two Timeframes ("TC Experts")

This strategy uses the TC Expert indicator in Two Timeframes. The 1-Hour TC Expert is used to determines trend. The TC Expert on a 10-Minute Chart is used for Trade Entry and Exit.
When the 1-Hour TC Expert is bullish, for example, then Trend is UP, and the strategy will buy when the 10-Minute TC Expert turns bullish. The strategy exits a buy trade when the 10-minute Expert turns bearish, or when price closes below a Gann Hi/Lo line that is used as a trailing stop.
Indicators used in this strategy & their inputs:
1-Hour Chart: TC Expert (7,18,36,7)
10-Minute Chart: TC Expert (7,18,36,7)
Gann Hi/Lo Activator - Gann HiLoA(7)


Chart 1. The TC Expert is composed of two separate indicators.
Trend
Trend is the direction of the TC Expert on the 1-Hour Chart. When the Schaff TC Expert is applied to the chart, two indicators appear, both a black Schaff Trend Cycle (�STC�) and a green Schaff Trend RSI (�STR�).


Chart 2. Trend changes are highlighted by the the red and blue vertical lines, after which the TC Expert indicator turns bearish and bullish, respectively.
Trend is UP when the TC Expert is bullish. The TC Expert is bullish when both the black STC and the green STR are rising above the lower red-dotted Buy line shown in Chart 2.
Trend is DOWN when the TC Expert is bearish. The TC Expert is bearish when both the black STC and the green STR are falling below the upper red-dotted Sell Line.
Trade Entry
The strategy uses the TC Expert and a Gann HiLo line on a 10-Minute Chart to time when to enter a trade. When Trend is UP the strategy will buy when price is above the Gann HiLo line and the 10-Minute TC Expert turns bullish. If Trend is DOWN the strategy sells when price is below the 10-Minute Gann HiLo line and the 10-Minute TC Expert turns bearish then the strategy sells.

Chart 3. With a DOWN Trend in place, a Sell Entry occurs on the 10-Minute Chart at 9:20 at 2.0387.
TC Expert Strategy: Buy Entry and Sell Entry rules:
BUY when 1-Hour Trend is UP and
1. The 10-Minute TC Expert turns bullish and
2. Price is above the Gann HiLo line
SELL when 1-Hour Trend is DOWN and
1. The 10-Minute TC Expert turns bearish and
2. Price is below the Gann HiLo line
Trade Exit
Various exit tactics are used, depending on how price could develop.
Trend Indicator Changes Direction
If the 1-Hour Trend changes direction then exit the trade.
Trade Entry Indicator Changes Direction
If the 10-Minute TC Expert changes direction then exit the trade.
Price Closes beyond Trailing Stop
The Gann HiLo line is used as a Trailing Stop on the 10-Minute Chart. If the strategy position is long, then exit if the 10-Minute price closes below the Gann HiLo. If the strategy is short, then exit if price closes above the Gann HiLo.
The chart below follows the GBPUSD trade shown in Chart 3.


Chart 4. The sell position exits when the 10-Minute TC Expert turns bullish.
The sell trade entered on October 3 at 9:20, at 2.0387, exited at 16:40, at 2.0313, when the 10-Minute TC Expert turned bullish (with both the STC and STR rising above 25). The result is a profit of 74 pips.
TC Expert Strategy: Buy Exit and Sell Exit rules:
Exit a BUY Position if one of the following situations occur
1. Trend changes to DOWN, or
2. The 10-Minute TC Expert turns Bearish, or
3. Price closes below the Gann HiLo on the 10-Minute Chart.
Exit a SELL Position if one of the following situations occur
1. Trend changes to UP or
2. The 10-Minute TC Expert turns Bullish or
3. Price closes above the Gann HiLo on the 10-Minute Chart.
Initial Stop Loss Order: Controls trade risk. Establish before the trade.

--- by : FX Strategy --------
Read more ...

Sunday, 23 August 2009

Forex Stochastic Momentum Index

Stochastic Momentum Index
SMI was created by William Blau in January 1993 issue of Technical Analysis of Stocks & Commodities. The SMI demonstrates where the close is relative to the middle of the last high/low range, in comparison to the close relative to the recent low/high with the Stochastic Oscillator, which resembles the Stochastic Momentum Index.
It's an oscillator that shifts between -100 and +100 and can be a bit less inconstant than an equal period Stochastic Oscillator. The oscillator consists of 2 lines - the moving average of the SMI (red) and the SMI (blue). The SMI will be negative if the close is less than the middle point of the range. The SMI will be positive if the close is greater than the middle point of the range.
The SMI interpretation is in fact the same as that of the Stochastic Oscillator. The most ordinary way of using it is to trade from is to sell when the SMI rises above +40 and then returns to the point under that level and to purchase at the moment when the SMI decreases under -40 and then shifts back above it. Another trading sign is to purchase when the SMI shifts above the moving average, and sell when the SMI decreases below the moving average.
Usually before basing any trades on strict oversold or overbought levels it is better to qualify the trendiness of the market using an indicator, for example, R-Squared. Levels should provide the most effective results if indicators provide a non-trending market trades based on strict oversold or overbought. 
Read more ...

Monday, 10 August 2009

Forex Aroon Oscillator

Trading with Aroon Oscillator involves the following signals:
Aroon Oscillator line above the zero � suggestion of a bullish market.
Aroon Oscillator line below zero � a bearish market.
The further the Oscillator line is from Zero level, the stronger the trend.
When values are near Zero line, the market is trending nowhere.
Details
The idea behind Aroon Oscillator
Aroon oscillator is based on Aroon Indicator. Aroon Oscillator is a trend-following indicator that illustrates the strength of a current trend and its potentials to last.
How to interpret Aroon indicator
An oscillator that oscillate between -100 and 100.
It oscillates around zero line, defining times when AroonUp and AroonDown lines of Aroon Indicator cross each other.
Aroon Oscillator Formula
Aroon Oscillator = AroonUp - AroonDown.

Aroon Forex charts example


Conclusion
The positive value of Aroon Oscillator indicates an uptrend, while the negative value indicates a downtrend. The higher the absolute value of Aroon Oscillator, the stronger the trend.

>>>>> See Aroon Indicator...Click here >>>>>>

--- SBJ ---- by:FxIndicator ------
Read more ...

Thursday, 16 July 2009

Forex Chart ; Symetrical triangle pattern

This pattern shows two converging trendlines (support levels & resistance levels) and is (1) a bearisch formation that usually forms during a currency pair downtrend as a continuation pattern (downtrend will continue) or (2) a bullish formation that usually forms during a currency pair uptrend as a continuation pattern. (uptrend will continue)

This pattern is confirmed when the currency pair price breaks out of the symmetrical triangle formation (1) to the downside and closes below the lower support trendline in order to continue the downtrend or (2) to the upside and closes above the upper resistance trendline in order to continue the uptrend.

What does a Symmetrical Triangle Formation look like?


The symmetrical triangle is marked by two important trend lines. At its top, there is a line of resistance where traders are willing to sell the currency pair. This resistance line communicates the fact that bearish currency traders are over time willing to pay lower and lower prices for the currency pair indicating a possible break out to the downside.

At it's bottom, the support line communicates the fact that bullish currency traders are over time willing to pay higher and higher prices for the currency pair indicating a possible break out to the upside.

How to trade this pattern?

For it's best prediction, an established trend should exist, either a strong down or a strong uptrend. Once the currency pair breaks out the symmetrical triangle, most likely, the price will continue it's previous trend.

Trade the breakout!

Chart example


Please note how the previous trend is an uptrend, once it breaks out the symmetrical triangle, it's uptrend continue! 
Read more ...

Friday, 10 July 2009

Forex ; Trendline Support and Resistance

The trendline. A trendline is a main initial element for the price chart analysis. While the market moves in any direction not along a straight line but along a zigzag, the mutual placement of upper and bottom points of those zigzags permits to plot a line connecting the significant highs (peaks) or the significant lows (troughs) of an appropriate zigzag using technical tools of the computer program.

To draw a trendline only two points are necessary and the third one is the contact point confirmation. On a bullish trend chart it should be drawn using troughs, on a bearish � using peaks. The trendline and a line which is about parallel to it and drawn on the opposite side (through peaks on a bullish trend and through troughs on a bearish) form the trade channel. Both lines are then channel's borders.

Lines of support and resistance. The upper and the bottom borders of trade channels are called accordingly support and resistance lines. The peaks represent the price levels at which the selling pressure exceeds the buying pressure. They are known as resistance levels. The troughs, on the other hand, represent the levels at which the selling pressure succumbs to the buying pressure. They are called support levels. In an uptrend, the consecutive support and resistance levels must exceed each other respectively. The reverse is true in a downtrend. Although minor exceptions are acceptable, these failures should be considered as warning signals for trend changing.

The significance of trends is a function of time and volume. The longer the prices bounce off the support and resistance levels, the more significant the trend becomes. Trading volume is also very important, especially at the critical support and resistance levels. When the currency bounces off these levels under heavy volume, the significance of the trend increases.

The importance of support and resistance levels goes beyond their original functions. If these levels are convincingly penetrated, they tend to turn into just the opposite. A firm support level, once it is penetrated on heavy volume, will likely turn into a strong resistance level. Conversely, a strong resistance turns into a firm support after being penetrated. In general, to evaluate the reliability (that is the possibility of a break) of the trade channel borders taking a decision to close or to save an existing position one should govern himself with following rules:

1. A channel is the more reliable the longer it exists. Hence, the solidity of very old channels (e.g. existing more than 1 year) decreased sharply.
2. A channel is the more reliable the more is his width.
3. The resistance may be broken if it is bounced on the background of a growing volume.
4. A steep channel is less reliable in compare to a gentle one.
5. The support may be broken independent on the volume.

----- SBJ --- by; T.Anderson ----- 
Read more ...

Monday, 15 June 2009

Forex CCI Divergence Breakout

Timeframe : 15mins and above
Indicator : CCI (Commodity Channel Index
Description : This strategy uses hidden divergence and price action to take a breakout trade
. Divergence is the one
key indication in the market that can be useful and is not lagging. It is a sign of a market reversal coming up in the near future. Understanding and making use of divergence will help a technical trader greatly when analyzing the market.


Note : On my CCI, I always connect my peaks (tops) never the bottoms (dips).

Long Breakout


- Price must be trending downwards
- CCI must go towards the upward direction and bounce
- After a bounce on the CCI, connect your high peaks on your price
- Aggressive : At a clear close above the trend line enter long
- Conservative : After the trend line is broken, wait for a pullback to the trend line to enter

Short Breakout

- Price must be trending upwards
- CCI must go towards the downward direction and bounce
- After a bounce on the CCI, connect your dips on your price
- Aggressive : At a clear close below the trend line enter short
- Conservative : After the trend line is broken, wait for a pullback to the trend line to enter

Stops

- If your trend line is not that steep, you can keep your stops at the high/low of the breakout candle.
- If your trend line is steep, keep your stop at the swing high/low
- If your trend line is medium steep, keep your stop at the low of couple candles away

Exits
- 1:1 Risk to reward. If your stop is -12 pips your limit should be +12 pips.
- Open 2 lots. If your stop is at -10 pips, once your trades goes in your favor and you're at +10 pips, close 1 lot and let the other one run. Exit at Support and Resistance levels.
the other one run. Exit at Support and Resistance levels.
- Exit at the nearest 50 or 00 level. These are psychological levels. (make sure your exit is at least the same number
of pips as your stop, otherwise dont enter the trade)
- Trailing Stop. Once in a trade, at the close of each candle, place your stop 1 pip below the low (if in a buy trade). Vise versa for sell trade.

Short Example


Long Example


Spread Trading Strategy
A properly placed stop loss can benefit your spread trading strategy. Make money whichever way the market is moving, rising or falling. Spread trading is tax free, opening a trade is easy, and you can close out positions quickly. Try it!

------- SBJ ------ by; Navin prithvani ------ 
Read more ...

Wednesday, 6 May 2009

FOREX Indicator � Williams %R Oscillator

WILLIAMS %R Oscillator - Developed by Larry Williams, Williams%R is a momentum indicator used to indicate overbought and oversold levels.

Overbought market conditions are found at the upper band (readings from 0 to -20) and oversold conditions at the lower band (readings from -80 to -100).

Interpretation

The interpretation is similar to the Stochastic Oscillator, except that Williams %R ranging scale is plotted using negative values from 0 to -100.
0 to -20 readings are considered overbought; -80 to -100 readings are considered oversold.

Formula

%R= -100x[(Highest High - Current Close)/( Highest High - Lowest Low)]

Popular trading signals from Williams%R

I. In trending markets


Take only signals from Williams%R in the main direction of the trend. If the main trend is up, take only oversold signals from Williams%R. Conversely, if the main trend is down, take only overbought signals from Williams%R


Some currency traders identify the currency pair's long-term trend and then use extreme readings for entry points. If the mid long-term trend is bearish for a currency pair, then overbought readings could mark potential entry points to go SHORT (again).

II. In ranging markets

Go long when Williams %R falls below the oversold level and rises back above
Go short when Williams %R rises above the overbought level and falls back below.

It is recommended to use Williams%R in conjunction with other technical analysis tools to make a complete forex trading system.

----- SBY ----By:Kent Gerard 
Read more ...

Thursday, 22 January 2009

FOREX Trading Indicator

Forex - Slingshot Reversal Strategy

A slingshot reversal is a reliable forex trading pattern and is defined as a false breakout + reversal and occurs when a major support or resistance point is broken but the currency price does not hold below support or above resistance and moves back into it's previous trading range. The below picture shows a slingshot reversal pattern for the GBP/USD on the 1 hour chart.

On May 15th, the GBP/USD finally broke out it's trading range between 1.9845 (1) and 1.9762 (2). This break below support created a wave of new downside pressure as longs cut their positions and traders sold the technical break below support.


Then a slingshot reversal pattern took place as the cable sellers ran out of steam below 1.9733 (3) and buyers gained the upper hand, and very soon, the GBP/USD start gaining back above it's previous support level only to move higher to 1.9870.

How to trade the slingshot reversal pattern:

1) Try to identify important levels of support and resistance that many forex traders are closely watching

2) When trading 1 hour charts, wait for the market to trade 10 pips below or above the key level (either support or resistance); then put a stop entry order 10 pips above or below that KEY level.

In our case:

When 1.9752 (1.9762 - 10 pips) trades, place an order to BUY cable at 1.9772 (4).

3) If the order is executed, then place your stop 3 pips below it's previous low(3) at 1.9730.

4) Calculating your profit target for 1.5:1 risk-to-reward ratio:

Pips at risk: 1.9772-1.9730 = 42 pips. Here's our take profit target: 42 pips x 1.5= 63 pips (5)

Summary:

The forex slingshot reversal is a reliable pattern with a strong logic behind it because of it's effect on market positioning. Look for major support and resistance levels that could yield forex slingshot reversals. 
Read more ...