Showing posts with label Forex Trading System. Show all posts

Thursday, 9 August 2012

Forex Indicator MACD 3-5-3

DearTrader
I�m going to reveal to you how to super-charge your indicators today...
You�re going get a complete, step-by-step guide on how to �hack� your indicators to:
-              Remove �lagging�
-              Find pin-point, laser-targeted entries
-              Boost your trading confidence
Not only that...
But this is something you will be learning (and trading) in less than ten minutes!
(I promise not to give you any �fluff� or �filler� and to keep this as short as I can)

Here�s Where Many Traders Go Wrong With Their Indicators...
Traders will use, say, a 10-period moving average and a 20-period moving average.
They will then wait for this 10MA to cross up above the 20MA � then BUY.
The problem with this is that price can already have made a significant move � like this:

In the chart above then you can see that price has already made a 34-pip move before the MAs have even crossed!
That�s no use to you is it? No. I didn�t think so.
Here�s the deal...
There are many things I can show you, but...
I�m Going To Show You The Simplest Way To �Hack� Your Indicators...
Here�s how it works...
I�m going to show you how to use the MACD indicator as an incredible �trigger� to entering trades.
You will be entering trades at the absolute lowest risk-point - in other words...
You Have A Very Small Stoploss!
The key to using the MACD in this way is forgetting the �Default Settings� of 12, 26 and 9.
We�re interested in bringing that right down to something like 2,6,2 or 3,5,3.
These numbers allow us to �super-charge� the MACD indicator so that it reacts quicker to the market that it would otherwise!
What we�re doing is riding-the-momentum of the market and using the MACD to �slingshot� us into a high-momentum trade.
Not only that... but we�re getting in with a very small stoploss too.
Let� say we�re using the MACD with 3,5,3 settings - take a look at this chart...
The easiest way to use the 3,5,3 settings for a BUY trade is to wait for the MACD to drop below 0.0 and then rise above it � like this:


This is an example from a couple of days ago - and it�s a good one!
But, you�re smart enough to understand that not every trading day is going to be this good, right? Good.
(A SELL trade would require the MACD to rise above 0.0 and then fall below)
Remember...
I recommend you use a little trial-and-error, and experimenting with the MACD and the lower-number settings.

--------- by sbudij -------- honest pip -----------


Read more ...

Friday, 1 June 2012

Simple Forex Strategy


Dear Traders. I found another very simple but very powerful system in my
Free Forex Systems library. It�s a free system and available for free on some
free Forex websites in different variations. I like it and I thought you may be
interested to try it.
Description:
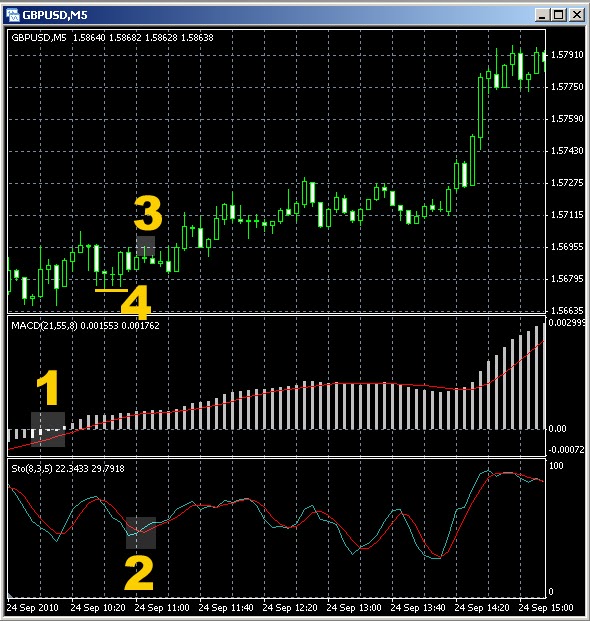
Simple Strategy. Using Slow MACD Indicator & Fast Stochastic.
This strategy is very simple and successful but will not get you in at the
beginning of the move or exit at the end but will give a high success rate.
Setup:
Timeframe: Any
Currency:Any
MACD: 21 55 8
Stochastic: 8 3 5
How it works:
When the MACD Line and Signal Line cross, wait for the Stochastic to cross in
the same direction!! (Don`t trade if Stochastic in overbought/oversold
zones)If you are an agressive trader you can enter when the MACD and
Stochastic cross at the same time, otherwise once the MACD has crossed, wait
for the Stochastic to cross before entering. (The MACD must cross first)
Exit the trade when the MACD lines cross back.


 1 � MACD signal line cross 2 - Stoch crossed in the SAME direction 3 �
ENTRY POINT ( long in this case) 4 � Recommended Stop loss 3 pips below
the nearest (in this case) support level
Stop loss: Place a stop loss Recommended Stop loss 3 pips below for LONG
entries or 3 pips above for SHORT entries the nearest support (for LONG) or
resistance (for SHORT) levels


 source  fr Karl Dtm     by : sbudij

Read more ...

Thursday, 17 May 2012

Forex TRAPPING Strategy


This method is basically to do with what a pair moved like the previous 24 hour period.
In this, I will use the GBPJPY, but one could use it on any pair.

Method/Strategy:
You choose your own 24 hour period move - here as an example I will be using 21:00 to 21:00 GMT+1 (my local time).
Mark the High, Low and Close for selected 24 hours.

For example, the GBPJPY for the last 24 hours was: H 138.67 L136.00 and C 138.13
Now total movement was (high-low) 267 pips.

You set your Buy and Sell orders 25% of the 267 total move away from the Close price. Therefore, 25% of 267 pips is 67 pips, thus your orders would be:
BUY at 138.80 (Close + 67 pips)
SELL at 137.46 (Close - 67 pips)
Set your TP also only to 25% of the previous days move - in this case also 67 pips. In theory, if the chosen pair then move only 50% of the previous days total move, you profit ...
Set your SL levels 10 pips away from the opposite order.

Depending on what time zone you are in, I would suggest setting your orders before "your" market opens ... in my case it would be the London Market at 08:00 GMT.


source fr other fx blog's


Read more ...

Saturday, 17 September 2011

Trend Finder Indicator

Spikes Trend Finder

I want to share a new system that I've been using.
It's very simple, Still room for improvements. Or eventually,
to semi-automate it. And send an email alert to my phone,
When conditions are right.

Well lets get to it.

1. You use the Day, 4h, 1h, Charts
2. Always trade with the trend
3. Always set SL, And TSL.
(EURUSD,EURJPY,GBPUSD,AND GBPJPY = 100/100)
(All others = 50/50)

You start with 2 MA's, An 18 smoothed open, With a 14 smoothed closed
These are to verify over all trend

Next, You will have 3 sets of RSI's on the bottom.

First set : 2 RSI's , An 88 period open, And a 56 period closed, No set min or max

Second set : 2 RSI's , An 88 period closed, And a 56 period open, No set min or max

Third set
: 2 RSI's , An 2 period open, And a 2 period closed, set 0 min and 100
max With 20,80 lines, Or 10,90 lines, Your chose


In a downward trend,
You wait until price hits, or passes the first MA,
On the 1h chart,Before you ever look for a reversal.
Of coarse, The closer to the average you can get on
the day chart, the better.

First, Look at the MA's, And make sure they are
staying parallel, Or expanding

Next, You look for a cross, On all 3 RSI indicators at the bottom

Then I place my trade with SL, And TSL.
I don't use a TP, But a TSL instead.
I'm a big fan of set it, and forget it trading

You would just reverse this for an upward trend.

---- sbudij by Spike fx factory ------

Read more ...

Sunday, 10 April 2011

Forex Trend Following Strategies

FX5 Forex Trading Strategy
FX5 forex trading strategy is a simple and effective trend following method for any major exchange rate. I hope you can adapt this strategy to suit your trading style.
Strategy Description: An intra day forex trend following trading method, using the
following technical indicators:
� 10 period WMA (Weighted Moving Average)
� 20 period SMA (Simple Moving Average)
� Slow Stochastic (10,6,6 (exponential))
� RSI (28)
� MACD (24/52/18 (exponential))

Forex Trading Rules:
1) Only take trades between 8AM-12PM EST and/or 2AM-4AM EST.
2) BUY the exchange rate when the 10 WMA crosses up past the 20 SMA and the Stochastic is signaling up (fast line above the slow line), RSI > 50 and the MACD histogram >0 and MACD averages crossed up.
3) SELL the exchange rate when the 10 WMA crosses down past the 20 SMA and the Stochastic is signaling down (fast line below slow line), RSI<50 and the MACD histogram <0 and MACD averages crossed down. 4) Try and take profits at or near key levels: Try and take profits at exchange rates ending with 00, 20, 50, 80 e.g. EUR/USD 1.1980 5) Stop-Loss Level: discretionary or below/above most recent level of support and resistance.

----- by Erol Bortucene -------
Read more ...

Thursday, 3 March 2011

YoutradeFX - Futures Broker

YouTradeFX is an internet brokerage and investment firm. Through the company�s website and trading platform, traders can invest in CFD�s (certificates for difference) on stock, commodities, indices and the foreign exchange market
YoutradeFX caters to a growing client base of private and institutional traders, 24 hours a day, 6 days a week, providing specialized trading services in over 10 languages
YouTradeFX has developed automated trading tools (expert advisors, custom indicators and scripts) that require minimal intervention and allow traders to automate their trading strategy, improve discipline, remove emotion, and capture opportunities. Traders can choose from over 20 predefined trading strategies to create custom portfolios and automatically execute trades according to their specifications.
Spreads: Competitive and low spreads from just 1 pip, fixed 24 hours a day.
Leverage: Greater buying power with leverage up to 1:400.
Fees: Commission free for all trading instruments.
Margin: There are no margin requirements for accounts under $100,000. We feature guaranteed Stop-Loss meaning that traders cannot loose more than their original investment.
Mini Trading: Traders may deposit as little as $100, and to open a position with as little as small as $10,000 or 0.1 Lots.
Account Classes: Traders can choose between four different account types: Mini for under $5,000, Standard $5000 -$25,000, Classic $25,000 - $100,000 and Premium Account for $100,000 and over.
49 Tradable Instruments: These include 36 currency pairs, Gold, Silver, Oil, CFDs on the world�s biggest indices including NASDAQ, Dow Jones, FTSE, CAC and so on. We also feature 17 stocks such as Google, GE, Microsoft, IBM, Wal-Mart and Apple .

Regulation and Compliance
As a financial investment company, YouTradeFX has a Category 1 Global Business License issued by the Financial Services Commission (FSC) of the Republic of Mauritius under the name of International Youtrade Investments MA Ltd. Company No.: 097392 C1/GBL; Category 1 Global Business, License ? C110008678.

International Youtrade Investments MA Ltd. 4th Fl. Unicorn Centre
18N Fr�re Felix de Valois St. Port Louis, Mauritius

You Trade Holdings Limited Offices
London Branch
12 The Shrubberies, George Lane, London
Germany Branch
Marienstra�e 19/20, 10117 Berlin-Mitte, Germany
Turkey Branch
Buyukdere Ave Meydan Str. Spring Giz Plaza 17, Sisli/Maslak Istanbul, Turkey
India Branch
A-41, Naraina Industrial Area, Phase II, 110028 New Delhi, India

=== YTFX Affiliate - The Best Forex Affiliate Program =====

YTFX Affiliate - The Best Forex Affiliate Program
1# converting forex broker.
Transparency with our Forex Affiliates.
Top offers including $250 CPA plus bonuses.
The best of the line marketing and statistic tools.
� 50% bonus for clients on first deposit
� 1 pip spread on major currencies
� Free expert advisors
� Professionally Managed account
� Free MT4 hosting
For more information regarding YTFX forex affiliate programs�Click Here�

---- YTFX === by ; sbudij -----
Read more ...

Thursday, 13 January 2011

ZULUTRADE News Update

I . ZULUTRADE Signal Provider Performance
� There was a time when trading was a headache. Not anymore! You don't have to study or monitor the market to make a good pick, because hundreds of signal providers from all over the world are doing it for you. All you have to do is pick the experts you like, and ZuluTrade will quickly convert their advice into live trades in your trading account directly with the broker. And the best of all, it's completely FREE !!! - see ZuluTrade Review

see..MARCH 2011...update�ZULUTRADE Signal Providers Performance... Click here

II . ZuluTrade just released a new version of website content with somecool New Features

1 . New ZuluTrade Desktop Widget!
ZuluTrade release the ZuluTrade Desktop Widget! View your account details in real-time without the need to be logged in to zulutrade.com!
What can you do with this Widget?
-View your account equity and profit/loss
-View your account PnL, open positions
-View your selected Signal Provider's performance charts
-Switch between your accounts

Mouse over the ZuluTrade widget for controls. Use left/right button for previous/next provider. Up/Down button changes between screens.
Visit www.zulutrade.com/?widget to download

2 . Provider Alerts: ZuluTrade created an automated system that detects changes in a Signal Provider's trading strategy. A warning message will be displayed in the Provider's profile page when:
Higher slippage than pips per trade is detected
Draw Down is more than 100% on Provider accounts with more than 1000 pips profit

3 . Fully Customizable Demos! By popular demand, Demos are now fully customizable. Customize your Demo account options: balance, currency and leverage

4 . Provider Notifications: ZuluTrade will send notifications to your email to inform you of certain events:
When a Signal Provider you follow has increasingly worse trades than his/her previous worst trade.
When a Signal Provider that you follow has stopped trading his live account in ZuluTrade.
When a Signal Provider that you follow has a significant change in his/her average trade time.
You can select which notifications will be sent to you from the Profile tab in your account.

6 .NEW iphone app version
Retina display support User Interface Improvements

7 .NEW economic calendar available
View upcoming/past economic events

Click Here�For a free ZuluTrade Demo account OR For a Live Broker account:

Visit ZULUTRADE detail Information Click� USER GUIDE or FAQ

Thank you for your interest and we look forward to having you join our family of Zulu traders


--- sbudij - Karawang Forex--------

Read more ...

Tuesday, 16 March 2010

The Forex Profit System

With extracts from the article �The Forex Profit System�
In this tutorial, I will be going through how you can benefit from EMA and Psar �. This System Iam combined w/ ASI and Pip Boxer indicator

This System Works with all types of time frames & Currency


Setting :

Time Frame 1M and 5M ( I used 5m f/ scalping )
EMA 25, EMA 50, EMA 100
Parabolic Sar : .02 and 2 ( default )

Time Frame 15M, 30M, H1
EMA 10, EMA 25, EMA 50
Parabolic Sar : .02 and 2 ( default )

Window Indicator
Accumulative Swing Index / ASI
Pip Boxer Indicator period 14 or 7


Buy = Long When the EMA 10 crosses The 25 and 50 OR when the EMA 25 crosses The 50 and 100 � UP from the bottom
See.. the ASI indicator and / or Pip Boxer indicator on the bottom / below 25 %

Sell = Short : If the EMA 10 cross The 25 and 50 OR When the EMA 25 cross the 50 and 100 - Down from the Top, you go Short / SELL
See.. the ASI indicator and / or Pip Boxer indicator on the top / more than 75 %

MAKE SURE THAT WHEN YOU GET INTO YOUR TRADE THAT THE PARABOLIC SAR IS ON THE BOTTOM WHEN YOU GO LONG...AND ON THE TOP WHEN YOU GO SHORT


Exit Trade : The best Time to Exit a trade is when the price crosses back down all 3 EMA�s on the Chart�

Images 1. chart GBP/USD TF 5M


Images 2. Chart GBP/JPY TF H1


Happy Trading ! - SBUDIJ -
Read more ...

Monday, 22 February 2010

The FxOverEasy System

This system work off 15 Min Charts. We are looking for 3 Things�3 reasons to entri the market.

1. DIRECTION


SHI Channell which automatically recalculated in real time gives us the direction we are going to trade. If slope is down we are only looking to sell. If Slope is up we are looking to buy.

IF THE THE CHANNEL IS THIN ( NARROW ) WE DON�T TRADE

If Price falls outside the channel�we don�t trade ( unless in trade already ) we wait for a new channel to form

2. ENTRY / EXIT


Remembering we only trade in the given direction of the slope of the SHI Channel

The Second is LaGuerre. When LaGuerre line cross down through .75 line ( top line ) look to SELL�..When the line crosses up thru .15 line ( bottom line ) look to BUY� if JUICE is still Green leave trade to opposite side of channel if it is Red then Exit trade when LaGuerre Reaches its Mid line (.45).

Perkyasctrend1 is for the weary and the last indicator to normally show Pink Dot Sell � Blue Dot Buy. This Indicator not Necessary for advance traders

Safety Stop�normally are 15 pips

3. VOLATILITY


This last but not least Indicator is called JUICE�. Never enter a Trade when Histogram is Red if all Indicators line up this is the last check and the Histogram shoul be Green


REMEMBERING.!!! We only Trade in the Direction of the Slope of the SHI Channel 
Read more ...

Saturday, 6 February 2010

' Andrew ' Forex�Trading System

Currency pair: any, but better cross-pairs that give good trends.
Time frame: any, but usually 4-hour
Indicators: supertrend, nonlagdot (value: 20)
Entry rules.

Buy: a dot of Nonlagdot changes from red to blue. At the same time dots of nonlagdot should be above the Supertrend line. Also the Supertrend line should be green. A position should be opened by execution of a pending order. The order is placed on the upper point of the market extremum, which is formed after the first rebounce of the market downward (when closing price is lower than previous one). That is one should wait untill the price has exceeded the point of extremum, and only then buy. However, if the price fails to exceed the level of the point of extremum, one should wait. After the formation of a new point of the market extremum, the order should be shifted to that point. If the color of nonlagdot or supertrend changes to red, the order shoud be canceled.


Sell: a dot of Nonlagdot changes from blue to red. At the same time dots of nonlagdot should be under the Supertrend line. Also the Supertrend line should be red. A position should be opened by execution of a pending order. The order is placed on the lower point of the market extremum, which is formed after the first rebounce of the market upward (when closing price is higher than previous one). That is one should wait untill the price has exceeded the point of extremum, and only then sell. However, if the price fails to exceed the level of the point of extremum, one should wait. After the formation of a new point of the market extremum, the order should be shifted to that point. If the color of nonlagdot or supertrend changes to blue, the order shoud be canceled.


Market entries without placing pending orders are not recommended.
Pending orders for market entries are placed with the regard of the amount of the spread and additional 3 pips.

Exit rules

I exit when:
1. The price touches the Supertrend line, or
2. The Supertrend line changes its color, or
2. The price touches the first line of the Fibonacci fan. The Fibonacci fan is constructed from the point of the market extremum at the beginning of its movement and up (or down) to the opposite extreme point of the current market, that is, from the bottom to the top of the movement (when buying) and from the top of the movement to the bottom (when selling). It is important not to confuse: the Fibonacci fan is constructed not from the market entry point, but from the point of the beginning of directional movement or trend (up or down). Fibonacci fan line, which is closest to the price, serves as the exit level. And the exit order should be moved on this line.

Stop-loss is set:
1. On Supertrend line, or
2. Below near price swing, or
3. Under (over) the closest extremum of the market, which exceeds the Supertrend line in the opposite direction.

Stop-loss order is placed with the regard of the amount of the spread and additional 3 pips.
The following money management is recommended: either not more than 10% of the capital per trade, or a progressive system (e.g. Fibonacci or semi-martingale). Martingale is not recommended because it is far too risky in case of the lack of capital after several consecutive losing trades.

Adding is recommended solely to profitable positions after the regular change of Nonlagdot color in the direction of the current trend.
Read more ...

Saturday, 23 January 2010

Omega Trading System by Forex Neutrino

Forex Neutrino Team just sent me an email and exclusive PDF File Trading Manual incl. Indicator from Omega Trading System. You should take a look / Free Dowmload

Forex Neutrino is a 100% Automatic system that does all of the
work for you. You can trade part time from home. Heck, you can
even run Forex Neutrino while your at your job and let it
pile up the profits for you until the day arrives that you can
tell your boss "take this job and shove it".

This system is based on the exact systems that the elite traders
like Bruce Kovner, Richard Dennis and John Henry used to make
millions and in Bruce's case Billions of Dollars.

I am living proof that anybody can make it in Forex, especially
after the accident that left me partially disabled and with me
being a high school drop out... Goes to show that you don't have
to be special to make it huge in Forex.... The way this system seeks out
winning trades and reads the Trends is amazing and you will surely
discover the true power of Forex Neutrino...


Please use the Neutrino Omega system to start trading and earning
real cash untill you have Forex Neutrino in your hands

Free Download Omega Trading System from Forex Neutrino�CLICK Here�. ( Indicator Plus Trading Manual )
Read more ...

Sunday, 3 January 2010

�Brain Trading� Profitable Trading System

Now I wish to comment about BrainTrading software indicator, a system best indicator which is till now, But many people who is having this indicator obtains it is incomplete or result of copy from assorted of source. Braintrading system very effective indicator if applied in correctness, myself had applied this system since last three years ago and proven effective and profitable. pleased download BrainTrading Trade manual to can be applied correctly/effective

How To Use BrainTrading System
BrainTrading System indicator package includes four main independently calculated indicators: BrainTrend1, BrainTrend1Stop, BrainTrend2, BrainTrend2Stop and four auxiliary indicators used for pictorial presentation of main indicators: BrainTrend1Sig, BrainTrend1StopLine, BrainTrend2Sig, BrainTrend2StopLine.

IMPORTANT! (BrainTrend1, BrainTrend1Sig, BrainTrend1Stop, BrainTrend1StopLine), (BrainTrend2, BrainTrend2Sig, BrainTrend2Stop, BrainTrend2StopLine), (BrainTrend1, BrainTrend1Sig, BrainTrend1Stop, BrainTrend1StopLine, BrainTrend2Sig, BrainTrend2Stop, BrainTrend2StopLine) are priority groups of indicators of the BrainTrading System

BrainTrend1 and BrainTrend2 are market �DIRECTION� indicator. It shows trend direction by colors, when the market changes to or stays in an up-trend, the bars become or remain BLUE. When the market changes to or stays in a downtrend, the bars become or remain RED. When the market goes sideways or is not strong on either side, the bars become or remain GREEN. BrainTrend1 and BrainTrend2 indicators can work with any time bar charts.

IMPORTANT! Don�t use BrainTrend1 and BrainTrend2 indicators on one chart at the same time. You need to use BrainTrend1 indicator as main on all charts and use BrainTrend2 as confirmative indicator in separate chart window.

BrainTrading system indicator Chart


Free Download BraimTrading system - Trade Manual CLICK Here...


Others Forex ebook - Free Download CLICK Here...
Read more ...

Saturday, 19 December 2009

Forex Trading System

a Simple One That�s Proven and Made Millions
Enclosed you will find a free Forex trading system with one rule which is simple and has made savvy traders huge gains for over 25 years. Let�s take a look at how you can use it for bigger Forex gains�

Of course you can buy a forex trading system but most sold are junk and only have simulated back tested results - this one on the other hand has made gains for over 25 years and will continue to do so.

The system was devised by one of the trading greats - Richard Donchian who is considered the grandfather of modern trend following and his insight on channels and the 4 Week Rule (the trading system below) are two methods all traders should know about.

Let�s take a look at how it works and it�s based on one simple rule, here it is.

Buy a new 4 week high and hold the position, until a 4 week low is hit then liquidate the long position and go short. Keep doing the following - buy new 4 week highs and sell new 4 week lows thereafter and always keep a position in the market.

You can�t get a much simpler system than the above and you don�t even have to think about what to do, the rule is clear and objective, you can simply follow it and it works; here�s why.

Forex markets tend to trend for long periods and these trends can be for many weeks or months. These trends tend to start and continue from new market highs or lows, so this system will put you in on every major trend and help you get a good chunk of the profits.

Don�t worry about its simplicity - forex markets are best suited to simple, robust systems. The trader who complicates his trading strategy normally will see it fail, as it has too many elements to break.

While the system is simple and works, most traders can�t follow it.

It takes tremendous discipline to follow long term trends and they prefer to use shorter term systems which make them feel better or safer - but of course don�t work. They also follow for the myths perpetrated by vendors, that you don�t get drawdowns in Forex - but you do, even the best systems have them. You have to trade through them, learn to take short term losses and look at the big picture which is longer term gains.

This system will never go out of date and is simple to understand, it also doesn�t take long to operate about 15 - 30 minutes a day and the rule tells you exactly what to do.

If you are looking for a long term Forex trading system that�s proven, rather than a simulated one which has never been traded and won�t work, then check out the free Forex trading system which is the 4 Week Rule and you maybe glad you did.
Read more ...

Tuesday, 15 December 2009

Forex Indicator - Accumulative Swing Index

Trading with ASI indicator involves the following details:
ASI has positive value � uptrend.
ASI has negative value � downtrend.
ASI trend line breakout � validates a breakout on the price chart.
Details
What is Accumulative Swing Index
Welles Wilder, the creator of ASI indicator said, "Somewhere amidst the maze of Open, High, Low and Close prices is a phantom line that is the real market." The Accumulation Swing Index shows this phantom line - the line of the real market.
The Accumulative Swing Index uses a scale from 0 to 100 for an up trend and 0 to -100 for a down trend.

How to interpret ASI indicator
If a long-term trend is up, the ASI has a positive value; and if long-term trend is down indicator appears in a negative value. During sideways moving market, the ASI moves between + and - values.
Accumulative Swing Index is widely used to confirm or deny trend lines breakouts on Forex charts.
Trend lines are drawn on both: a chart and indicator�s graph and then compared against each other to confirm/dismiss trend line breakout signals.

How to trade with Accumulative Swing Index
Welles Wilder, developer of Accumulative Swing Index indicator, describes in his book "New Concepts in Technical Trading Systems" why ASI can be used for trend line breakout confirmations. He said, that ASI is able to show the real strength and direction of the market and since Accumulative Swing Index is heavily weighted in favor of the close price, daily upward and downward spikes do not adversely affect ASI.
Here is a quote from his book:
"When the Index is plotted on the same chart as the daily bar chart, trend lines drawn on the ASI can be compared to trend lines drawn on the bar chart. For those who know how to draw meaningful trend lines, the ASI can be a good tool to confirm trend-line breakouts. Often erroneous breaking of trend lines drawn on bar charts will not be confirmed by the trend lines drawn on the ASI. Since the ASI is heavily weighted in favor of the close price, a quick run up or down during a day's trading does not adversely affect the index."
Signal Buy with ASI occurs when indicator exceeds its previous Swing High.
Signal Sell occurs when ASI dips below its previous Swing Low.

Accumulative Swing Index chart example


Since ASI line represents real market price, Forex traders may effectively use classic technical analysis methods on the indicator itself:
- identify support/resistance levels,
- trend lines and true market direction,
- swings high/low,
- breakout setups
- and divergence between indicator and regular price charts.
Accumulative Swing Index indicator formula
ASI = ASI formula

Where:
C = Today's closing price
Cy = Yesterday's closing price
Hy = Yesterday's highest price
K = The greatest of: Hy - C and Ly - C
L = Today's lowest price
Ly = Yesterday's lowest price
O = Today's opening price
Oy = Yesterday's opening price
R = This varies based on relationship between today's closing price and yesterday's high and low prices
T = the maximum price changing during trade session

---- by; Forex Indicators / ASI -------


Read more ...

Sunday, 6 December 2009

Forex ; Trading Double Tops and Double Bottoms

Trading Double Tops and Double Bottoms
No chart pattern is more common in trading than the double bottom or double top.
In fact this pattern appears so often that it alone may serve as proof positive that price action is not as wildly random as many academics claim. Price charts simply express trader sentiment and double tops and double bottoms represent a re-testing of temporary extremes. If prices were truly random, why do they pause so frequently at just those points? To traders the answer is that many participants are making their stand at those clearly demarcated levels.

If these levels undergo and repel attacks, they instill even more confidence in the traders who've defended the barrier and, as such, are likely to generate strong profitable countermoves. Here we look at the difficult task of spotting the important double bottom and double tops, and we demonstrate how Bollinger Bands can help you set appropriate stops when you're trading these patterns.


React or Anticipate?
One great criticism of technical pattern trading is that setups always look obvious in hindsight but that executing them in real time is actually very difficult. Double tops and double bottoms are no exception. Though these patterns appear almost daily, successfully identifying and trading them is no easy task.

There are two approaches to this problem and both have their merits and drawbacks. In short, traders can either anticipate these formations or wait for confirmation and react to them. Which approach you chose is more a function of your personality than relative merit. Those who have a fader mentality - who love to fight the tape, sell into strength and buy weakness - will try to anticipate the pattern by stepping in front of the price move.


Reactive traders, who want to see confirmation of the pattern before entering, have the advantage of knowing that the pattern exists but there's a tradeoff: they must pay worse prices and suffer greater losses should the pattern fail.


What's Obvious Is Not Often Right
Most traders are inclined to place a stop right at the bottom of a double bottom or top of the double top. The conventional wisdom says that once the pattern is broken, the trader should get out. But conventional wisdom is often wrong.

Leaving the trade early may seem prudent and logical, but markets are rarely that straightforward. Many retail traders play double tops/bottoms, and, knowing this, dealers and institutional traders love to exploit the retail traders' behavior of exiting early, forcing the weak hands out of the trade before price changes direction. The net effect is a series of frustrating stops out of positions that often would have turned out to be successful trades.


What Are Stops For?
Most traders make the mistake of using stops for risk control. But risk control in trading should be achieved through proper position size, not stops. The general rule of thumb is never to risk more than 2% of capital per trade. For smaller traders, that can sometimes mean ridiculously small trades.

Fortunately in FX where many dealers allow flexible lot sizes, down to one unit per lot - the 2% rule of thumb is easily possible. Nevertheless, many traders insist on using tight stops on highly leveraged positions. In fact, it is quite common for a trader to generate 10 consecutive losing trades under such tight stop methods. So, we could say that in FX, instead of controlling risk, ineffective stops might even increase it. Their function, then, is to determine the highest probability for a point of failure. An effective stop poses little doubt to the trader over whether he or she is wrong.

Implementing the True Function of Stops

A technique using Bollinger Bands can help traders set those proper stops. Because Bollinger Bands incorporate volatility by using standard deviations in their calculations, they can accurately project price levels at which traders should abandon their trades.
The method for using Bollinger-Bands stops for double tops and double bottoms is quite simple:

1. Isolate the point of the first top or bottom, and overlay Bollinger Bands with four standard-deviation parameters.
2. Draw a line from the first top or bottom to the Bollinger Band. The point of intersection becomes your stop.

At first glance four standard deviations may seem like an extreme choice. After all, two standard deviations cover 95% of possible scenarios in a normal distribution of a dataset. However, all those who have traded financial markets know that price action is anything but normal - if it were, the type of crashes that happen in financial markets every five or 10 years would occur only once every 6,000 years. Classic statistical assumptions are not very useful for traders. Therefore setting a wider standard-deviation parameter is a must.
The four standard deviations cover more than 99% of all probabilities and therefore seem to offer a reasonable cut-off point. More importantly they work well in actual testing, providing stops that are not too tight, yet not so wide as to become prohibitively costly. Note how well they work on the following GBP/USD example.


More importantly, take a look at the next example. A true sign of a proper stop is a capacity to protect the trader from runaway losses. In the following chart, the trade is clearly wrong but is stopped out well before the one-way move causes major damage to the trader's account.

Conclusion
The genius of Bollinger Bands is their adaptability. By constantly incorporating volatility, they adjust quickly to the rhythm of the market. Using them to set proper stops when trading double bottoms and double tops - the most frequent price patterns in forex - makes those common trades much more effective.

--- by; Boris Schlossberg / director of currency research at GFT Forex. ----
Read more ...

Friday, 4 December 2009

Forex Trading System

Profitable Trading System
Open any chart for any currency pair, any time frame. I will use EUR/USD 1H as an example.
Next, attach Bollinger bands and OsMA indicators. Default settings for both.
What we are going to use here is a classic trading method called Divergence trading. divergence simply happens when the indicator and price are going in opposite directions.

The indicator we are going to use for Divergence is the OsMA indiactor.

To avoid false Divergence signals, we are going to use Bollinger bands. Valid signals are only the ones that happens when price hits overbought � oversold levels of Bollinger bands.
Images1


When that happens we should know that price will reverse. In the above example, price was going up. So we are waiting for a sell signal. If price was going down, that means we are waiting for a buy signal.


Entry Rules �
Buy signal :

1 � Divergence
2 � Price hits Bollinger band�s oversold levels

Entry signal:
1 � when price starts to reverse up from the oversold level
2 � OsMA forms a new bar above 0 level.

Images2

Entry Rules �
Sell signal :
1 � Divergence
2 � Price hits Bollinger band�s overbought levels

Entry signal:
1 � when price starts to reverse down from the overbought level
2 � OsMA forms a new bar below 0 level.

Images3


Stop Loss :Last support resistance level.
Target :You have the choice to exist your trades when ..
1 � price hits the opposite Bollinger band�s level Or
2 � an opposite signals is generated

This system works great on 15M time frames and higher. Not recommended for smaller time frames.
The system is not to be used with major news releases.

It�s not the holy grail, but it�s a very good start. Try it and remember that practice makes perfect.

----- by ; Forex Warlord -------
Read more ...

Saturday, 28 November 2009

Forex ; Ross Hook Trading Strategy

Joe Ross has been trading and investing since his first trade at the age of 14, and is a well known Master Trader and Investor. He has survived all the up and downs of the markets because of his adaptable trading style, using a low-risk approach that produces consistent profits. Joe Ross is the creator of the Ross Hook � (Rh), and has set new standards for low-risk trading with his concepts of "The Law of Charts�" and the "Traders Trick Entry�" (TTE). Joe Ross has a few preferred trading signals, but we will present here the Ross Hook and the Traders Trick Entry.

Ross hook could be created on charts after:

1. First correction after a 1-2-3 pattern breakout;
2. First correction after a ledge pattern breakout (A ledge consists of a minimum of four price bars. It must have two matching lows and two matching highs. The matching highs must be separated by at least one price bar, and the matching lows must be separated by at least one price bar.);

First correction after a trading range breakout (A Trading Range is similar to a ledge, but must consist of more than ten price bars.).

The definitions are from "Law of Charts" by Joe Ross. This is very useful reading also.

During an uptrend when the market fails to make new high, a Ross Hook is formed. During a downtrend when the market fails to make new low, a Ross Hook is formed. Every directional price move reaches a point of exhaustion and needs new participants to continue. That is why the market takes its breath and at this point a Ross hook occurs. The Ross hook could be identified when the market is trending not when it is in a phase of consolidation. We skip the signal if the market opens with gap beyond the Ross Hook.

With the Traders Trick Entry TTE we try to open position before the other traders. We can make profits in trading only if we take other people's money. We have to learn how we can be one step ahead of the other market players. When Ross Hook, 1-2-3 pattern or other chart formation occurs most of the traders will place their orders at these levels. The Big boys know this very well and often target these order to make easy profits. They move the prices towards the nearest major level and activate the orders around only to reverse the price movement towards the stop losses. TTE is designed for such cases. When we see Ross hook and expect a test of this level we try to open a position early and make a nice profit if the break is successful with good risk/reward ratio. In most of the cases if the break of the Rh is false we can close our position with small profit


Long Position

1. The high of the last period is lower than the high of the previous Ross hook is formed;
2. The price retraces lower and the high of every period is lower than the previous one. The retracement should be 3-5 periods max;
3. We place a buy order above the high of the last period with stop loss below its low;
4. When the long position is opened we place limit order according to our money management rules. We suggest closing part of the position and move the stop loss to break even when the Rh level is reached.

Short Position

1. The low of the last period is higher than the low of the previous Ross hook is formed;
2. The price retraces higher and the low of every period is higher than the previous one. The retracement should be 3-5 periods max;
3. We place a sell order below the low of the last period with stop loss above its high;
4. When the short position is opened we place limit order according to our money management rules. We suggest closing part of the position and move the stop loss to break even when the Rh level is reached.

---- by : Svetlin Minev ------
Read more ...

Tuesday, 27 October 2009

Forex Trading Strategy - Bagovino Method

Forex Strategy �Method Bagovino� very simple, trade is conducted on the 1-hourly chart (H1), it must install EMA (close) with a period of 5 and 21. And as RSI indicator with a period of 21. All these indicators are in any standard set of terminal Metatrader 4.

In installations RSI indicator determines the level of 50.
Once the 5 and 21 EMA cross and up, and RSI indicator crosses a bottom-up level 50 - open the deal to buy (remember - the transaction should be opened only after the closing hour candles and candle digging the new hours!)
Conversely, as soon as the EMA cross on the graph down, and the RSI indicator falls below 50 - opening the deal to sell (remember - the transaction should be opened only after the closing hour candles and candle digging the new hours!) The best situation as soon as Both intersections occur simultaneously (the intersection of EMA and RSI indicator crosses a level 50).

This forex strategy at history has shown about 85% of profitable signals!
For work, you can choose any currency pair.

Examples see in the picture:

The first time (the situation on the left) - First there was the intersection Movings, but we had a deal only a few hours later, after the RSI has crossed the level of 50 and closed below it.

The second time (the situation on the right) - the intersection Movings and RSI occurred for 1 hour, an hour after closing a deal was made for the purchase.
Stop-loss recommend stavt at your discretion (subject to approval by you MM (risk management) - as you see fit, but I still recommend risking no more than 0,5-2% of the depot for each transaction and stop-loss set: purchase - below the previous low candle in the sale - maximum above last candle).

Also propose to use the indicator forex Vegas 1 Hour to determine the levels for the partial closure profitnyh trade positions. For example, you have opened a bargain on a signal Bagovino 0.3 lots. On the first line can close the 0.1 unit, and the rest put in the level �zero� (well suited for this trailing stop). On the second line cover is 0,1 lot, and have the remainder of the latter can close or you can just pull it into profit and into the �free floating�, treylenguya rest position such as at a distance of 25-50 points, while hoping to catch a trending move. 
Read more ...

Forex Trading Platform - Meta Trader 5

The difference between MT5 and MT4
The function of MT5 is much stronger than MT4.

Firstly, MT5 terminal is able to use more and more financial products. At present, except of forex and futures, it can also use in other financial products including the stocks and the options.

Secondly, the function of MT5 becomes more and more. Here are details of new functions:

1. Twenty-one kinds of time phase analyze the quotes.
2. There are thirty-eight internal indicators.
3. Thirty-nine image object.
4. There are four Zoom modes.
5. Seventeen specialized display indicator styles.
Read more ...

Tuesday, 20 October 2009

Forex Scalping Strategy

Using Fibonacci Levels for Scalping the Forex Market
This article is part of our guide on how to use scalping tequniques to trade forex. If you haven't already we recommend you read the first part of series on forex scalping.

Scalping a strongly trending market is very different from scalping a quiet, tame market where price action is confined in a small range and is going nowhere. In a ranging market scalpers will buy or sell, and wait until the price comes back to where it left, and keep gathering small profits until the prevailing range pattern is eliminated. When trading a trending market, however, we must be careful to ensure that our orders follow the established trend. Counter-trend scalping is also possible, but since the preferred strategy of most successful traders is trend following, we�ll concentrate our attention on using fibonacci extensions in a trend following method in this article.

High volatility requires a strict approach to realizing both losses and profits. A scalper who is trading in a tame, range-bound market can be a bit more relaxed and arbitrary about his risk controls (they must still be applied with discipline, but not in the robotic manner which must be applied in trending markets), because the market is not expected to make sharp movements due to fewer market participants and a smaller amount of liquidity (not to mention that there is no news catalyst for strong price movements.) But a trend scalper must deal with such conditions at all times.

Trend Following Method
In this section we�ll discuss the use of the Fibonacci extension levels for the determination of trade direction while scalping trending markets. Scalping in trends can be difficult, because of the size of the sudden fluctuations, and the lack of clarity (at least in the short term) with respect to the eventual destination of the price. The Fibonacci extension levels are very useful in analyzing trends in all cases, and scalping is no exception to the rule

Our aim in using this indicator is identifying levels where the price may rebound. For drawing the extension, we�ll identify the beginning and end of the price movement which we expect to be extended, so to speak, in order that a new trend is created. In the 5-minute chart of the USDCHF pair, we have identified a sudden and sharp movement beginning at around 4 am on 23rd July, and decided to draw its extension after the first red bar where its momentum is temporarily checked. Upon drawing the extension in the indicated area, we notice the 61.8, 100, and 161.8 extensions of the first movement.

Careful examination of the chart above shows us not only that the price rebounded several times at the extension levels of the indicator, but also that these levels served as strong attractors pulling the price towards themselves. The 100 percent extension level, for instance, provided a support which prevented the price from �falling through� twice, as observed. And the other two levels similarly created performance bars for the trend which, once broken, created further momentum for the trend.

Trading against a trend is dangerous, and the risk of sudden reversals is no less dangerous for scalpers. As such we need a tool which will help us identify the general direction of the trend, so that even if we suffer some losses, eventually our gains will justify our trading activity. The Fibonacci extension level is a great tool for this purpose since it allows us to guess with a reasonable degree of accuracy the main momentum of the price action. In the above example, we�d be scalping the market by buying at the red arrows shown on the chart. If the price returned to the resistance or support levels indicated by the extension level, we�d stop trading for a while and await the market action to present some clarity (is the trend reversing?) But as long as the trend is intact our strategy would involve scalping between the extension levels to accumulate profits.

---- by; forextraders.com ----
Read more ...