Showing posts with label Profitable Forex System. Show all posts

Saturday, 25 April 2015

THE MOST ADVANCED FOREX INDICATORS

Hello there !
Do you know what the Trend Scanner and the Forex Currency Index are? Well, they're probably two of the most advanced indicators in the Forex industry!
Most advanced Forex Indicator: Trend Scanner and Forex Currency Index
  • Trend Scanner: searches for trends in ALL currency pairs and time frames... simultaneously!
  • Forex Currency Index: spots market inherent strength and weakness, and tells you where temporary unbalances can be found.
They are specifically programmed by savvy trader Hector Deville's coder, and they're INSANELY powerful.
Here's the video :

Price is 37$ for both Indicators. Instant download, no limit, no expiry !
Any question, email to hectordeville [at] my [dot] com
Read more ...

Sunday, 5 January 2014

DOWNLOAD HECTOR DEVILLE MT4 INDICATORS


Original Price
$297
Discount Price
$47

Instant download, no limit, no expiry, forever usage

Price is 47$ for 3 Indicators. Instant download, no limit, no expiry !
Any question, email to lumina920 [at] nokiamail [dot] com
Read more ...

Friday, 23 August 2013

HIGH PROBABILITY DIVERGENCE SETUPS

Welcome to the second part where I am explaining how you can use divergence with some tips and tricks I have learnt over the years to pinpoint market turning points with high accuracy. 

In the part 1 (price swing prediction) we discussed standard divergence and what to look for with your preferred indicator to spot this setup. Now its time to dig a little further and see how deep the rabbit hole goes! 

High Probability Divergence Setups!

Through years of trial and error I have discovered what works and what does not. Divergence by itself is a bit hit and miss, you never really know if the divergence will play ball or not. This is probably why many traders give it a try then decide to leave it for something 'supposedly' better. Sadly, they didn't know how close they were to the pot of gold!

By combining divergence with some simple price action tools we can turn that hit and miss setup into a very accurate entry technique.

Before we go into these tools, let me show you my absolute favourite type of divergence. I call it the DTD & DBT (double top divergence / double bottom divergence). This type of divergence has pinpointed trend reversals more times than I can remember. All you are looking for is a double top or double bottom in price then for your preferred indicator to also show strong divergence. 

Below is an example of a DBD on the GBPUSD 4H chart, this setup captured a 700 pip trend reversal! In all examples below I am using RSI indicator set to 6 for divergence.
I know what you're thinking, that was cherry picked and just a one off right? Wrong, these setups happen all the time across all pairs, in fact lets take a look what happened at the end of the 700 pip move shown above.

Yep you guessed it another DTD which again captured a trend reversal of almost 900 pips!
The reason DTD and DBD setups are so powerful is because they combine confluence of support or resistance into the setup. In order to have similar success with standard divergence you will need to be extra picky about the setups you choose. Look for setups that happen as price is coming up against strong areas of support or resistance.

Timing Your Entries!

Entry's can be tough because most entry techniques are lagging and therefore get you into the move late eating into your potential profits. But don't worry, I am going to show two price action entry techniques I use all the time with astonishing success trading divergence setups.

Once I have a DTD/DBD or standard divergence with strong confluence I start watching price action at the close of each new candle. I am waiting for one of the two candle formations below to clearly appear. 
Once the candle formation forms and the candle has closed (very important) I enter at market with stops above/below the candle formation.

If you take another look at the two setups above on the GBPUSD you will see that both setups triggered with an engulfing candle formation! A fluke? Nope, this happens all the time :-)

Ok, so that's part two of this mini divergence course over and done with hopefully it has provided you with some new tools to add to your trading toolbox. Remember, the key to success is to be picky, wait for strong confluence to line up or better still a DTD/DBD setup.

We are not done yet though,  Follow me
over the next few days for more awesome divergence tips and tricks.
Have fun & good trading!
Read more ...

Sunday, 18 August 2013

BANK TRADER REVEALS BREAKOUT STRATEGY

Hello traders,

Today I would like to show you a technique that is valid for all currency pairs and all time frames (my group in the bank tend to use it mostly on the Daily and Weekly charts to avoid market choppy noise). The name of this strategy is the Breakout, Congestion and Continuation pattern, and it�s a high probability setup given the right circumstances. If you master this technique, you could achieve a 75% to 80% win/loss ratio!

The key concepts are the universal pattern of any currency pair : continuation pattern after a strong momentum breakouts of key Support / Resistance levels, using candlestick formation made by 3 consecutive candles.

Search for the pattern only upon the breakout of a significant horizontal level of support / resistance 

The pattern : You must see a solid breakout candle breaking through the Support / Resistance level

Don't trade if you get "shaky" breakout candles

Trade only when you see one small candle beyond the support / resistance level, then place your stop orders as shown below

Close 50% of the trade at the close of the first continuation candle, then move stoploss to break even.

Finally, close remaining 50% of the trade at the close of the second continuation candle.

There is 75%-80% winning ratio if you follow this strategy. Good luck !

Read more ...

Saturday, 10 August 2013

HOW TO PREDICT PRICE SWINGS IN ADVANCE

Have you ever wished you had an indicator that would predict a price swings in advance? Well chances are you already do, it's just that you have yet to discover how to harness its power. 
Confused? Don't worry it will become clear! 
I'm not a big advocate of indicators, I do use some common indicators in my trading but all indicators have a major flaw when it comes to trade entries. Indicators follow historic price and consequently are always lagging behind price. However there is a technique to use selected indicators in relation to price structure, which can give you an accurate leading indication of when price will turn! 
I am of course talking about Divergence. I know divergence is no big secret, but when used properly it is extremely powerful in predicting price swings. If you have never used divergence then you are in for a real treat. If you already use it then hopefully some of these tips and tricks will help increase your accuracy. Over the next 2-3 posts I will share with you what I have learnt from the many years of trading divergence setups. I have a tested a multitude of different indicators, entry techniques and time frames. I have discovered through backtesting plus trial and error what works and what does not. 
First things first, lets get the basics out of the way, once you have a grasp of the basics we will discuss some cool tips and tricks I use which will help you spot these powerful setups plus get in at the right time.
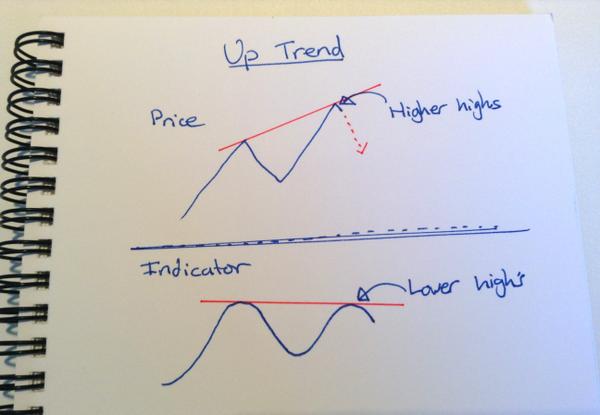
For standard divergence, we are watching the highs and lows of price in relation to the highs and lows of the indicator. In an up trending market we are watching the higher highs and waiting for the indicator to begin showing lower highs. In a down trending market we are watching the lower lows and waiting for the indicator to begin showing higher lows. 
Please see my crude sketches below for reference. :-)


The red doted price line indicates the expect direction of price due to the divergence setup.
What indicator should you use? 
Many oscillators will work fine for spotting divergence. Here are a few that I have used with great success.
- MACD (trigger lines or histogram) 
- Stochastic 
- RSI 
People tend to have their own favourites so have a play around and see what suits you. 
A high percentage of the time strong divergence can be a good indication that the current trend is over at least temporarily. So not only can you take advantage of the divergence swing you can also use it to manage trend trading methods. 
This stuff will work on any time frame but in my experience it is easier to spot on 4H and Daily charts so you may want to start there. 
In the next post I will show you another type of divergence which is extremely accurate and my personal favourite. I will also discuss some little tricks I use to help increase the accuracy of these setups even further. 
Your mission - should you choose to accept it, is to head over to your charts, go back over the history and start looking for divergence. Have a play with a few indicators and see which you prefer. 
Before I go I will leave you with one quick example of how powerful divergence can be when used properly. The chart below is a 4H chart of the EURUSD just before the huge trend reversal
Keep a close look out for part 2 (high probability divergence setups) of this series. Have fun & good trading! 


Read more ...

Tuesday, 16 July 2013

TREND EXHAUSTION COLLAPSE STRATEGY

Trend Collapse Forex Strategy

Today I want to share with you a powerful Forex strategy that works on any time frame and any currency pair because its principles are virtually universal. This strategy seeks to exploit the sharp reversal moves we occasionally see in our charts once an established trend shows weakness. When this happens, traders who had been riding that trend are very quick to protect their hardearned pips by closing out at once all their trend-based trades, and therefore the market bias suddenly changes. 

When a trend starts collapsing

Everyone says that the safest way to trade Forex is by trading only in the direction of the trend. But what about when the trend comes to an end? Should you stop searching for trading opportunities altogether? Not at all!

In fact, when a trend begins to lose its momentum, the market goes through a period of sudden �mass panic� as every trader closes his formerly-profitable trend-riding positions before the trend goes belly up. So� what happens when a large portion of the market jumps out of the market at the same time? well, basically the market -and the former trend- collapse!

And right THEN and THERE is exactly when you want to be ready to profit from that sudden market collapse.!

I hope you enjoy and use this strategy� trust me, it�s powerful stuff!

The outer trend line

In order to define the breakout point, meaning the point upon which the market will deem the trend as weak or as jeopardized, we must draw the trend�s outer trend line. This trend line is to be set from the trend�s original focal point. It�s impossible to determine an exactly number of bars or candles we are to scroll back in our chart in order to define the trend�s starting point, so that�s something that you, as a trader, will have to gauge from a visual point of view. Please mind that we�ll only be interested in the very outer trend line, so please do not draw any inner trend line at all. The outer trend line is the last line of defense for a trend, so once the outer trend line give way, there�s nothing beyond to hold the price fall. 

The Pullback

Upon the breakout of the outer trend line, we�re not to trade the initial breakout thrust. Initial breakout thrusts are risky because we might be caught up in a fake breakout. In order to protect ourselves from these fake breakouts, we will wait for that initial breakout thrust to die out and then we will wait for the first swing pullback.
That first swing pullback usually comes back to rest either breakout levels or the outer trend line from the other side. That�s precisely where we�ll be hiding behind the bushes, ready to enter the price as price eventually pulls back to either of the mentioned levels.

Trade strategy set up

As already mentioned, we will enter the trade exactly at the moment when, after the pullback, price begins to turn again in the direction of the original breakout. Needless to say, we will be trading only in the direction of the original breakout, or what�s the same, in the opposite direction of the trend that has just broken.
Basically, the idea is to wait for the pullback to be completed so, once price begins to curl around once again in the direction of the original breakout thrust, we can jump onboard as tightly as possible from the bounce point.
There is no particular formula or price pattern to trigger the trade. We will simply try to be as nimble as possible in order to trigger the entry just as the bounce begins to take place. It�s important to enter into the trade as close as possible to the bounce point, but without actually getting ahead of it: firstly we wait for the pullback to die out, then we wait for the bounce, and then we simply trigger the trade as nimbly as possible.
The stop loss will be placed immediately beyond the bounce point.
We will use a three-point exit policy, exiting a 33% of our lot size at each consecutive level:
� Target #2 will be around the end of the initial breakout thrust.
� Target #1 will be mid-way through between our entry level and our target #2 level.
� Finally, target #3 will be located at the projection of the full breakout swing measured
from the bounce point.
We will trail our stop loss to break-even when price hits our Target #2.
Here is a live examples of the Trend Collapse strategy applied to actual real Forex charts.
Please mind that this strategy works on�
� Any currency pair.
Any time frame (best used on H1 chart and above though).
� Any market direction (both after a down trend or after an up trend, the market dynamics and the way to trade this technique are exactly the same). 


Your Questions and Comments Are Always Welcome !
Read more ...

HECTOR DEVILLE HINDSIGHT ORACLE INDICATOR

This indicator based on the Repetitive Nature of the markets and price pattern. The Hindsight Oracle analyzes current market conditions and current price patterns, then browses through historical data searching for the same patterns. Based on how price developed after those past patterns, it gives out a potential outcome.
Original Price$197
You will get a high probability projection of upcoming price behaviour, the indicator will also give you a quantified projection in pips, if the projection goes according to your plans, you have green lights. If not, it keeps you away from problematic trades.
  
This unique advanced indicator price is worth 197$, work on any instrument: forex , gold, index,.....etc
Original Price $197
Discount Price $27
Instant download, no limit, no expiry, forever usage 
Read more ...

Thursday, 20 June 2013

RSI ADX BOLLINGER COMBINED SYSTEM MT4 INDICATOR

Hello
Today I would like to bring you a useful beautiful mt4 indicator named JOGET invented by an savvy Indonesian trader with nick name masemus.
The system use a combination of these basic technical indicator RSI, ADX, BOLLIINGER BAND to help generate as highly accurate as possible entry point. It will also display useful info like trend, Pivot point, broker time, your computer time, and 3 levels to take profit .......
How to use the RSI ADX BOLLINGER COMBINED system, just click the screenshot below to see :
It's free download and free to use without any limit at this link JOGET2U
The file is compressed with password, to view the password, scroll down to the comment area after clicking here RSI ADX BOLLINGER SYSTEM INDICATOR
Read more ...

Saturday, 8 June 2013

MULTI TIME FRAME TRADE ADVICE INDICATOR

Trend_alex is a multi timeframe indicator to identify the trend. It's advantage is the advice to open trade or wait for better moment, Trend Indicator Alex is very simple to use and fits any trader. By default it measures trend in 3 timeframe : 15M, 1H and 4H
Rule to enter trade is very easy, just follow the text displayed on your chart, Buy/sell when it tells you to buy/sell and there are 3 level to take profit displayed on the right side to help you decide when to exit the trade, example is below :
If you buy this system, you will receive the Super Trend Norepaint Signal  FOR FREE
Price is 27 USD, no limit, no expiry, instant download 
Any question, email to marketivaster [at] gmail [dot] com
Read more ...

Saturday, 19 June 2010

Most Profitable Forex System, EARobot

With 97$ you will receive (all are working and have instruction manual Forex Worldcup Championship Packages( LMD-Multicurrency, HiRider Advanced, SuperVolcano, Fusion-v, Neg-Correlation,..) Harmonic Pattern Indicator, Caspian best scalping robot, Neutrino (signal+ EA), Forex Nitty Gritty whole package, Powerband Dominator, Dean Saunders Package, Forex Wonder, Forex Bling, Delphi Scalper, Forex Overdrive, Fish Forex Robot, Forex Trend Scalper, ADX, Forex Auto Trader, Super ADX Breakout signal, FX Key System, FapturboExpertGuide, Megadroid robot+ Advanced Droid Tactic, Caliber FX pro, Ivybot, Primeval-EA, 4X Pip Snager, Forex Harvestor, Elliott Wave Indicator, Forex Maximizer, Wealth Robot, Forex Poison Hacked, ForexCashEvolution, Forex Multivers, Forex Black Panther, Forex Shocker2.0, FX Engine 3.0 system, Reservoir Pips, StealPIPS, Easy Clear Profitable Signal, Forex Brilliance, Night Fox, FX Cyclone, Enforcer, Usdbot, Gbpbot, Forex Lexus, EAzeGor Winalot, King Cobra system, Juggernault, Knight Rider, Forex autopilot F.A.P.S, Forex Humanoid, Fibonacci Killer, Meta4 Signal System,
Forex Invincible Ultimate Pro EA, Mercenary, Rebellion, Forex Profit Launcher, Stealth Forex System, Ea shark, Ultimatum system, Elliott Wave Analysis, EA-BOSS, Kain Harvester, EA-KSP, EAS, MD-Pro, Forex Millionaire, Forex Hacked 2.2, PandaBot, Dragonpips, Elliott Wave Counting Software, G-force, Steinitz hedge, Forex Funnel, Fx nuke, EA BOSS, Pipminer, Sniper Forex, Euro-Blaster, Forex Hitman, Forex GodFather, Forex Mafioso, Forex Assasin, Forex Detector, Joury-EA, LMT Formula2.1, Forex Confidante2.0, Conqueror, 10 minute forex wealth builder, 5 ema system, London Forex Rush system, Forex Blade Strategies and many more ....ForexCobraSystem, FxNuke,
USDBOT,  ETOFSystem, Poseidon, ForexTwister,  4XPipSnagereBookSystem
Forex-Neutrino-Signals Neutrino_EA NeutrinoBooster  ForexPhantom, Steinitz Fractal Breakout, CorrelationIndicators, TriadFormula, MegatrendFX, Site-Lite, MEGA TREND FLOW METER MINI, FXScalper2.0, Championship2008 SMART, TradeCopier, Forex Gforce, Robot No Loss ForexWarlord, Black Swan Forex, FOREX SIGNAL 30EXTREME, Forex Equity Builder, Aeron Forex Auto Trader, Forex GodfatherEA, SupremoFx, Gomegaxray143, FedoraFX, Broker Nightmare, FXPROMaker2, ExcaliburV3, ForexHitter, EA_Electra, The channel scalper, Forex Invader, Forex Infinity Pro, Forex Lexus, Trend Shadow 2.0, ForexScaner, DivergenceTrader, 16 ZigAndZag tradeV2, Spikes Martingale From Hell, Stochspike wacken a scalper, PLUM CRAZY 6, Forex cash detective, Quantum Traderv5.0, Elite Spoutnik, RoboMiner2.18, EABOSS, EARoyalwave, EvolutionX, GT Shadow v3.09, PointBreak 5, DestinyADX, Forex Profit Monster System, SteinitzHASMTF, ProFx, Stomper, ForexBomber, Forex Auto Trader, Triangular Arbitrage, Xtreme EURGBP v2, Pipzu Extra polated, Chameleon2010FULL, EA Banking FX  Diamond, EURGBPV4, Derk Synergy System, EA SHARK3.0, EA Banking FX, Ultra EURUSD,  ForexMafioso, Fractals3EA, TrendStuffer41, EAForexTornado, FrancescoEATrendline, Intelectual Pro, GOMega, PyramidEA ULTIMATE v2010, TRIANGULAR PRICE CORRECTIONG, AbahEa, EAForexmaven, AutomaticForexGrail.
Get instant download to all above including ALL I am selling individually!
Credit Card, Paypal (97$) all will arrive your email instantly

email stphnlam906@gmail.com if you want to use Liberty Reserve

Accept all credit cards
Read more ...