Have you ever wished you had an indicator that would predict a price swings in advance? Well chances are you already do, it's just that you have yet to discover how to harness its power.
Confused? Don't worry it will become clear!
I'm not a big advocate of indicators, I do use some common indicators in my trading but all indicators have a major flaw when it comes to trade entries. Indicators follow historic price and consequently are always lagging behind price. However there is a technique to use selected indicators in relation to price structure, which can give you an accurate leading indication of when price will turn!
I am of course talking about Divergence. I know divergence is no big secret, but when used properly it is extremely powerful in predicting price swings. If you have never used divergence then you are in for a real treat. If you already use it then hopefully some of these tips and tricks will help increase your accuracy. Over the next 2-3 posts I will share with you what I have learnt from the many years of trading divergence setups. I have a tested a multitude of different indicators, entry techniques and time frames. I have discovered through backtesting plus trial and error what works and what does not.
First things first, lets get the basics out of the way, once you have a grasp of the basics we will discuss some cool tips and tricks I use which will help you spot these powerful setups plus get in at the right time.
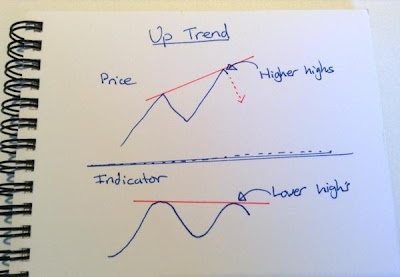
For standard divergence, we are watching the highs and lows of price in relation to the highs and lows of the indicator. In an up trending market we are watching the higher highs and waiting for the indicator to begin showing lower highs. In a down trending market we are watching the lower lows and waiting for the indicator to begin showing higher lows.
Please see my crude sketches below for reference. :-)
The red doted price line indicates the expect direction of price due to the divergence setup.
What indicator should you use?
Many oscillators will work fine for spotting divergence. Here are a few that I have used with great success.
- MACD (trigger lines or histogram)
- Stochastic
- RSI
People tend to have their own favourites so have a play around and see what suits you.
A high percentage of the time strong divergence can be a good indication that the current trend is over at least temporarily. So not only can you take advantage of the divergence swing you can also use it to manage trend trading methods.
This stuff will work on any time frame but in my experience it is easier to spot on 4H and Daily charts so you may want to start there.
In the next post I will show you another type of divergence which is extremely accurate and my personal favourite. I will also discuss some little tricks I use to help increase the accuracy of these setups even further.
Your mission - should you choose to accept it, is to head over to your charts, go back over the history and start looking for divergence. Have a play with a few indicators and see which you prefer.
Before I go I will leave you with one quick example of how powerful divergence can be when used properly. The chart below is a 4H chart of the EURUSD just before the huge trend reversal.
Keep a close look out for part 2 (high probability divergence setups) of this series. Have fun & good trading!


No comments:
Post a Comment