Tuesday, 30 September 2008

Forex Trading System

Forex Trading System
The "RickyD" System


After many attempts I found the only way to get it was write down what I did and thought about as I was trading and that is what has become the Ricky D Strategy / System.

I have worked the settings on these indicators until they work. They can be used on the 15, 30 minute, and 1 hour with success. They will even work fairly well on the 5 minute if anything really does. I like to use the 30 minute and just so you know I don't check other time frames, I just park and trust the indicators.
I trade the 4 majors and trade from 2:00AM till about 10:00AM or the volume drops EST or (-5 GMT). I try not to be in a trade during news releases.

I have found as many have said, a trend is not a trend until it starts to move. I follow what the chart is doing, not what I think it will do. I used to give up to many good trades thinking the market was in a certain trend. My bias did not help me but hurt me and my trades. You can only act upon what is happening on the charts so anything else will kill your trades.

Four Indicators:
CCI (5) Line at +100, 0, and -100
Forecast Oscillator: Rperiod (15) t3_period (3) and b(0.7) Line at 0
Relative Vigor Index (1) Line at 0
ADX (14) Line at 20
(�Pivot� custom indicators / BT1 / BT2Sig / BT2Stop / Volume /)

Directional Indicators:

5MA (Linear Weighted/Close) Red
20MA (Linear Weighted/Close) Blue
100MA (Linear Weighted/Close) Green
200MA (Linear Weighted/Close) Sandal wood

* The cross of the 5MA with the 20 MA favors the direction of the trade, (5MA on top favors Long trade, 5MA on bottom favors Short trade. And don�t trade too close to the 100MA, acts as a resistance line).

Entry (Long):

The CCI needs to be greater than (0).
Forecast Oscillator needs to have both lines above the 0 line with the blue line on top.
The RVI needs to have both lines above the 0 line and the style (Blue) line on top.
The ADX Main and DI+ need to be at least 20 and rising.
No BT2Stop in the way of the entry bar.
Must be 15 pips away from a support or resistance line. (�Pivot� in custom indicator folder)
The 100MA(LW/Close) no closer than 20 pips in the direction of the entry.


Entry (Short):
The CCI needs to be less than (0).
Forecast Oscillator needs to have both lines below the 0 line with the red line on top.
The RVI needs to have both lines below the 0 line and the red line on top.
The ADX Main and the DI- need to be at least 20 and rising.
No BT2Stop in the way of the entry bar.
Must be 15 pips or more away from support or resistance line.
The 100MA(LW/Close) no closer than 20 pips in the direction of the entry.

Exit: The RVI lines cross with the wrong color on top and a slight separation in them (0.2) (or) the RVI Style line crosses the 0 line against the trade. (up while in a short / down while in a long) which ever happens first.
Read more ...

Monday, 29 September 2008

Free Forex Signal

Free Forex Signal, 30 September 2008
Update every day at 01.30 am GMT ( 08.30 WIB )

Today update 01.40 am GMT

All Pair � Stop loss 30 Pips


EUR/USD
Pivot : 1.4420
Avg. Daily Range : 242 point
BUY at 1.4434 Exit Target 15 pips
SELL at 1.4354 Exit Target 20 pips


GBP/USD
Pivot : 1.8105
Avg.Daily range : 302 point
BUY at 1.8078 Exit Target 15 pips
SELL at 1.7967 Exit Target 20 pips


USD/JPY
Pivot : 104.90
Avg.Daily range : 212 point
BUY at 104.02 Exit Target 15 pips
SELL at 103.31Exit Target 20 pips


AUD/USD
Pivot : 0.8094
Avg.Daily range : 244 Point
BUY at 0.8060 Exit Target 15 pips
SELL at 0.7914 Exit Target 20 pips


CHF / USD & USD/CAD � Stop loss 35 pips
GOLD � Stop loss 350 pips ( 3,5 USD )

USD/CHF
Pivot : 1.0926
Avg. Daily range : 204 point
BUY at 1.0988 Exit Target 15 pips
SELL at 1.0878Exit Target 20 pips


Usd/Cad
Pivot : 1.0407
Avg.Daily range : 123 point
BUY at 1.0486 Exit Target 15 pips
SELL at 1.0439 Exit Target 20 pips


GOLD
Pivot : 898.71
Avg.Daily range : 4791 point
BUY at 916.10 Exit Target 150 pips
SELL at 897.90 Exit Target 150 pips

Note : Gold � Stop Loss 350 pips ( 3.5 usd )

Read more ...

Sunday, 28 September 2008

Free Forex Signal

Free Forex Signal, 29 September 2008
Update every day at 01.30 am GMT ( 08.30 WIB )

Today update 02.05 am GMT

All Pair � Stop loss 30 Pips


EUR/USD

Pivot : 1.4617
Avg. Daily Range : 216 point
BUY at 1.4519 Exit Target 15 pips
SELL at 1.4477 Exit Target 20 pips


GBP/USD
Pivot : 1.8413
Avg.Daily range : 235 point
BUY at 1.8304 Exit Target 15 pips
SELL at 1.8254 Exit Target 20 pips


USD/JPY
Pivot : 105.83
Avg.Daily range : 164 point
BUY at 107.05 Exit Target 15 pips
SELL at 106.51Exit Target 20 pips


AUD/USD
Pivot : 0.8300
Avg.Daily range : 180 Point
BUY at 0.8347 Exit Target 15 pips
SELL at 0.8263 Exit Target 20 pips


CHF / USD & USD/CAD � Stop loss 35 pips
GOLD � Stop loss 350 pips ( 3,5 USD )


USD/CHF
Pivot : 1.0882
Avg. Daily range : 159 point
BUY at 1.0989 Exit Target 15 pips
SELL at 1.0942 Exit Target 20 pips


Usd/Cad
Pivot : 1.0347
Avg.Daily range : 109 point
BUY at 1.0375 Exit Target 15 pips
SELL at 1.0334 Exit Target 20 pips


GOLD

Pivot : 884.87
Avg.Daily range : 4065 point
BUY at 880.90 Exit Target 150 pips
SELL at 865.90 Exit Target 150 pips

Note : Gold � Stop Loss 350 pips ( 3.5 usd )
Read more ...

Friday, 26 September 2008

Forex Indicator

Forex ; Fibonacci Swing
We were asked to post some strategies that will work on smaller time frames.
Here is one very nice trading system that can be worth your attention.
When a trader chooses to use small time frames (like 10 min, 15 min, 30 min even 1 hour) risks to be wrong are always higher than with larger time frames.
Therefore, it is very important to have a really good Forex trading system that can advise on entries with high chances to win and what's more important it should be able to tell exactly where to exit without need to constantly monitor the price.
Note also, the more traders look at charts, the more they tend to have controversial feelings about the success of a current open trade...
With all this long introduction, it is only left to mention that this strategy will require from traders basic knowledge of use of Fibonacci tool.
What is Fibonacci tool and how to use it? Simply Google "forex fibonacci" phrase and you'll find a lot of information about it.
...This is probably the only reason we classified this trading system as Complex one, not every trader is comfortable with using Fibonacci studies in Forex.
Trading setup:
Time frame: any over 5 min and less than 3 hour.
Currency pairs: any.
Indicators: 5 WMA
Rules:
Look at the price waves. Find the most recent swing high and the most recent swing low = so called Fibonacci A swing and B swing.
Pull Fibonacci from A to B.
To know which direction to pull (up or down) simply look at the trend; if it is unclear, find appropriate AB swings and set Fibonacci in both directions.
Once set, wait and watch the retracement from AB swing to unfold.
During the retracement there are three conditions to be met in order to consider trading:
1. The price must touch 5 WMA.
2. The price must at least touch 0.382 Fibonacci retracement level.
3. The 0.618 Fibonacci retracement level must not fail. Here it means the price should not close below (uptrend) / above (downtrend) 0.618 retracement line. It can touch or poke it, but the level must withstand the "attack".
When all three criteria are met, enter once the candle is clearly closed above 5 WMA for Long entry, below - for Short.
Stop order is placed always 4-5 pips above (downtrend) / below (uptrend) the 0.618 Fibonacci retracement level.
Profit target is set to 1.618 Fibonacci expansion level derived from point A.


Read more ...

Thursday, 25 September 2008

FREE FOREX SIGNAL

Free Forex Signal, 26 September 2008
Update every day at 01.30 am GMT ( 08.30 WIB )

Today update 02.15 am GMT

All Pair � Stop loss 30 Pips


EUR/USD
Pivot : 1.4649
Avg. Daily Range : 252 point
BUY at 1.4693 Exit Target 15 pips
SELL at 1.4629 Exit Target 20 pips


GBP/USD
Pivot : 1.8449
Avg.Daily range : 318 point
BUY at 1.8463 Exit Target 15 pips
SELL at 1.8348 Exit Target 20 pips


USD/JPY
Pivot : 106.30
Avg.Daily range : 169 point
BUY at 106.10 Exit Target 15 pips
SELL at 105.65Exit Target 20 pips


AUD/USD
Pivot : 0.8361
Avg.Daily range : 186 Point
BUY at 0.8382 Exit Target 15 pips
SELL at 0.8347 Exit Target 20 pips


CHF / USD & USD/CAD � Stop loss 35 pips
GOLD � Stop loss 350 pips ( 3,5 USD )

USD/CHF
Pivot : 1.0876
Avg. Daily range : 180 point
BUY at 1.0860 Exit Target 15 pips
SELL at 1.0820 Exit Target 20 pips


Usd/Cad
Pivot : 1.0342
Avg.Daily range : 129 point
BUY at 1.0347 Exit Target 15 pips
SELL at 1.0325 Exit Target 20 pips


GOLD
Pivot : 878.55
Avg.Daily range : 3771 point
BUY at 883.30 Exit Target 150 pips
SELL at 870.80 Exit Target 150 pips

Note : Gold � Stop Loss 350 pips ( 3.5 usd )

Read more ...

Wednesday, 24 September 2008

FOREX INDICATOR

Forex Indicator Report
Be Prepared! U.S. New Home Sales at 14:00 GMT.

We encourage our customers to get involved in the most intense market events. As such, we think you should know that the U.S. New Home Sales figures are expected tomorrow, September 25th, 14:00 (GMT), and you need to be prepared. Market events like this one tend to create either big changes to current trends or push current trends even further. Generally, the Majors are the ones most affected by market events in general, but Crude Oil, Gold prices, and even the price of Silver can change dramatically in the seconds after such a publication. For more information about the U.S. New Home Sales, please read below.
What is the U.S. New Home Sales?
U.S. New Home Sales is a leading economic indicator used to measure the annual number of new single-family homes that were sold during the previous month. While this is a monthly figure, it is reported in an annualized format. This report predominantly helps to validate trends seen in other forward-looking housing indicators, such as the Existing Home Sales.

It is a leading indicator of economic health because the sale of a new home impacts a wide variety of consumer spending, such as furniture and appliances that are purchased for the home, a mortgage that's being sold by the financing bank, and brokers that are paid to execute the transaction. Also important is the inclusion of mandatory and optional insurance on these new homes.

As a result of the mortgage crisis in the U.S., which has continued to threaten world markets, the importance of the housing sector has increased significantly.

Expectations for this month are suggesting that the U.S. New Home Sales will reach 510K in August, reflecting a 5K decrease since July. Such a result could demonstrate a shrinking housing sector in the U.S., which has been one of the U.S. economy's greatest concerns. It is widely known that this crisis was initiated as a result of the non-covered mortgages that dropped mortgage banks one by one, and have just recently taken the 160-year-old Lehman Brothers bank to the point of filing for bankruptcy protection. A decreasing figure will most likely be interpreted by investors as yet more proof that the American people are avoiding buying new homes, and that the mortgage banks are reluctant to offer mortgages as freely as they used to. Such a scenario will probably extend the greenback's bearish movement, and the EUR/USD might rise to test the 1.4800 level.

When the actual figure is higher than forecasted, traders are likely to see the USD appreciate against its currency pairs and crosses. The radical trading week we have just experienced, which included an extremely volatile trading session, concluded with significant weakness for the USD. Investors are now following the opportunity to make profits out of their open positions on the USD, and a better-than-expected figure on the New Home Sales survey, such as 540K will possibly provide them that exact opportunity. Such a figure is good because it will ease global market concerns regarding an expanding mortgage crisis. U.S. citizens feeling confident enough to purchase new homes is the best news that the American leadership can hope for, and the USD will rise in accordance. In this turn of events, the EUR/USD might correct itself down to reach as low as the 1.4400 level.

---- by; myForex Brokers ------
Read more ...

Friday, 19 September 2008

Using Divergences to Identify Market Reversals

Using divergences correctly can help spot key market turns

Many traders and analyst use price-momentum divergence to identify trend reversals. For those of you who are not familiar with this term divergences may be defined as follows:

* Bullish divergence: When price lows are lower in a trend but momentum lows are higher
* Bearish divergence: When price highs are higher in a trend but momentum highs are lower

Basically what this is effectively saying is that momentum, that is the pace of the trend, slows then the underlying momentum indicator will not confirm the new price extremes by making new momentum extremes.
For example, it is easy to see from this chart that there has been a strong uptrend.
Below the price chart is a form of the Relative Strength Index (RSI)

Note how the RSI is showing a bearish divergence. As you can see price highs are still rising but the RSI peaks have begun to fall. This is a feature that often accompanies a stronger reversal in the trend.

Is this a confirmed reversal signal ?

Let�s see what happened next:
In fact the uptrend continued in spite of the divergence.

While this special version of RSI provides better divergence signals it is vital that price also confirms a reversal. This can be done using several methods.

Firstly, by considering the definition of an uptrend:

Price is making higher highs and higher lows.

To confirm price reversal then we should wait for it to decline below the last significant low. In the first chart price had declined very little and therefore the risk of price continuing its uptrend remains.

Secondly, by looking for break of a trend support:

In this case no break of the support line was seen until after the 2.1160 peak. This was also accompanied by a bearish divergence and therefore confirmed the reversal of the trend.

Note that after breach of the trend support how price later moves back to retest the line. This often provides excellent trade opportunities.

It is a common error that traders anticipate a trend reversal merely because there is sign of a divergence. However, this is not a 100% safe strategy. Unless there are other indications to confirm it is safer to wait for confirmation of the reversal.

Good luck
Read more ...

Wednesday, 17 September 2008

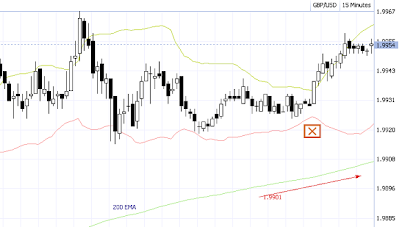
MA and bollinger tighten

Bollinger bands are very useful in determining price direction. You will notice that whenever the bands tighten, price explode out in a direction that is pretty much determined by the attitude of the 200 EMA.
Read more ...