Thursday, 31 March 2016

Advanced Price Movement Predictor Pro Edition MT4


Advanced Price Movement Predictor Pro Edition MT4 | MetaTrader 4 | Forex Indicator | MQL - MQL4 | Custom Indicator [Online Code]

 Most of the classic indicators that make up the common trading strategies are based on simple math, not because when these indicators were created there were no outstanding mathematicians (in fact there were probably best mathematicians then than now), but because computers did not exist or they simply had a low processing power to perform complex mathematical operations consistently. Nowadays, any smartphone surpasses overwhelmingly the most powerful computer just a few decades ago. So the ability to process huge amounts of information is not a limitation in these days, except for extremely complex process simulations.

Advanced Price Movement Predictor (APMP) indicator takes advantage of current processing capacity to capture the essence of price swings through some of the most advanced mathematical, statistical and probabilistic concepts.

APMP does not provide a prediction itself, since the price movement is a non-stationary stochastic process and therefore it is not predictable. However, it makes a dynamic and highly reliable estimation of the immediate price movement.

Based on the same analysis, APMP displays the current real trend of the market. Why real trend? Is not real the trend obtained with other indicators? So far the trend is almost always obtained from classic indicators like Moving Averages, Bollinger Bands or Parabolic SAR, or simply by the traditional method of manually drawing a line (or two parallel lines) between two or more significant points.

Obviously, those indicators and methods are still valid, especially since they are used by most of the traders, but do most of them obtain sustained profits? We have the intuition that they do not. With this indicator you can strengthen or improve your current trading method, or you can simply dismiss it because you will see that even the most chaotic behavior, such as the market price, respects the large numbers and is limited to the rigor of the all powerful mathematical laws.

How to Use It

Basically, the use of APMP is not different from how you regularly use trends, and support and resistance levels. The fundamental difference is in the reliability and robustness of those values calculated by this indicator.

Regular use of APMP is as follows:

For trading strategies based on the trend, traders must buy in areas near the support levels while the trend is up, and sell in areas close to the resistance levels while the trend is down.

For trading strategies based on trend corrections (counter trend), traders must buy in areas near the support levels while the trend is down, and sell in areas near the resistance levels while the trend is up.

Notice that significant levels can act either as supports or resistances, so it is important to keep that in mind when designing our trading strategy and pay special attention to the price behavior whenever it is close to those levels.

The Stop Loss could be located at a distance from the open price equal to the separation between the support and the resistance levels, and Take Profit distance could be twice the previous separation. Also, it would be a good idea to use a Trailing Stop feature to move the Stop Loss when support and resistance levels are moving in favor of the position.

The strategy outlined above is only a basic suggestion, but APMP provides enough information to create a variety of trading strategies and improve the existing ones.

It will be interesting to hear about different strategies derived from this indicator.

Read more ...

Saturday, 26 March 2016

Forex Trading Secret Revealed: How to Trade Forex Successfully with Secret Strategies and Indicators


Forex Trading Secret Revealed: How to Trade Forex Successfully with Secret Strategies and Indicators Been trading now for many years and have tried trading off all time frames but have finally found the secret of making real money trading the forex markets. You�re about to learn what most traders never know about trading. You can be wrong 50% of the time and still make loads money! In this course you�ll discover specific step-by-step trading money management strategies, used by successful traders, that you can literally drop into your current trading system and see immediate profit increasing results.
Read more ...

Monday, 21 March 2016

Machine Learning for Finance

I've long been a fan of machine learning, and actually this is how I started off with my study into computational trading - back in the day looking at neural network solutions for trading algorithms. I quickly learnt that it was not an easy area to apply this technology, and at that time I was hand-coding all the algorithms myself. I decided that I need to know more about trading in general, before trying to apply raw computational power - I needed more knowledge of the domain area.

I recently decided to take up machine learning again, this time using Python programming language. Python has rapidly become a key programming language in the area of computational finance and analysis, and there's a library for almost anything you can think of. The language itself is not too hard, but understanding all the different library functions is the main difficulty here.

For my first steps I just wanted to try something simple, yet relevant. I've used a machine learning algorithm to classify candles types for EUR/USD (daily candles). This is using K-means clustering (with k = 16) on normalized candle data. As expected it has learnt a set of 16 candle shapes and sizes, nothing particularly special about them - they could be any randomly picked candles from the last few years of data. However, these have been learned as exemplars of broad classification types.


This was really just an experiment in programming and using  the libraries. Next I will extend the study, and look at classifying candles at the tops/bottoms of ranges, see if there is some change.

Further down the line, it should be possible to look at patterns of candles (e.g. 3 candle patterns), and classify these into common groups.
Read more ...

Sunday, 13 March 2016

How to Profit with Forex Trading: How I made $26725.09 in One Week Using Forex Technical Indicators


How to Profit with Forex Trading: How I made $26725.09 in One Week Using Forex Technical Indicators

 For many forex traders (or any type of trader, for that matter), long gone are the hopes of making millions of dollars overnight, and all they wish to do now is stop losing money and begin to turn their trading accounts around. There are many mistakes that traders make that contribute to getting themselves into this situation, and this book is going to cover the top technical analysis indicators that can turn their accounts and performance around!
Read more ...

Friday, 11 March 2016

Sentiment in the Forex Market: Indicators and Strategies To Profit from Crowd Behavior and Market Extremes (Wiley Trading)


Sentiment in the Forex Market: Indicators and Strategies To Profit from Crowd Behavior and Market Extremes (Wiley Trading)
Jamie Saettele

 Crowds move markets and at major market turning points, the crowds are almost always wrong. When crowd sentiment is overwhelmingly positive or overwhelmingly negative ? it's a signal that the trend is exhausted and the market is ready to move powerfully in the opposite direction. Sentiment has long been a tool used by equity, futures, and options traders.

In Sentiment in the Forex Market, FXCM analyst Jaime Saettele applies sentiment analysis to the currency market, using both traditional and new sentiment indicators, including: Commitment of Traders reports; time cycles; pivot points; oscillators; and Fibonacci time and price ratios. He also explains how to interpret news coverage of the markets to get a sense of when participants have become overly bullish or bearish. Saettele points out that several famous traders such as George Soros and Robert Prechter made huge profits by identifying shifts in crowd sentiment at major market turning points. Many individual traders lose money in the currency market, Saettele asserts, because they are too short-term oriented and trade impulsively. He believes retail traders would be much more successful if they adopted a longer-term, contrarian approach, utilizing sentiment indicators to position themselves at the beginning points of major trends.
Read more ...

Sunday, 6 March 2016

MACD with Histogram - indicator for MetaTrader 5

This forex-indicator modifies the original MACD.mq5 from MetaTrader 5 Indicators/Examples folder.
It presents MACD Main and Signal in Lines Style, and includes the MACD Histogram in visualization.
Periods of EMA Fast, EMA Slow and Signal are freely customizable, as well as applied price.

Input parameters:

input int                InpFastEMA=12;               // Fast EMA period
input int                InpSlowEMA=26;               // Slow EMA period
input int                InpSignalSMA=9;              // Signal SMA period
input ENUM_APPLIED_PRICE InpAppliedPrice=PRICE_CLOSE; // Applied price

Download forex-indicator
Read more ...

Tuesday, 1 March 2016

MACD with Histogram - indicator for MetaTrader 5

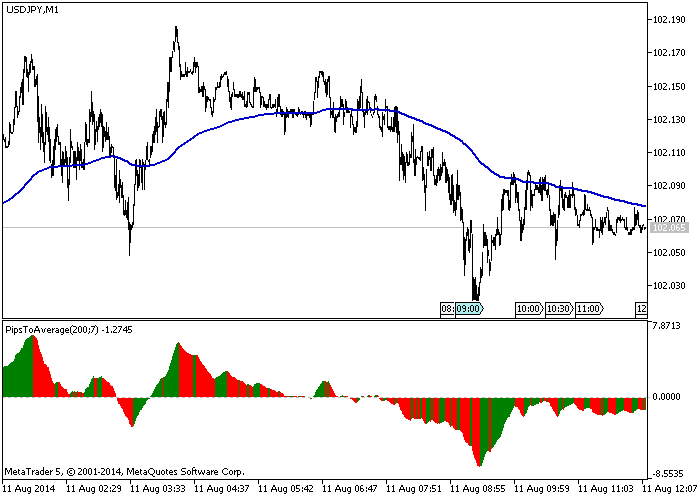
This forex indicator measures the (smoothed) distance in pips between the close and an exponential moving average.
The first input, Period_Average, is the period of the exponential moving average. The forex indicator first computes an array containing the difference between this average and the corresponding close price. Then, it computes an smoothed moving average with period Period_PipsToAv (the second input) of this array.
Here you can show an image with this indicator with parameters 200 and 7, as well as the 200-exponential moving average:

indicator


Download forex-indicator
Read more ...